World Cup Goalkeeping: How Shot-Stopping Wins Tournaments
Why a hot goalkeeper is the cheapest path to a long World Cup run.
There is a particular kind of World Cup hero who barely touches the ball in the opposition half: the goalkeeper who, for four or five matches, simply refuses to be beaten. Across a short knockout tournament, where a single goal decides most of the consequential games, no outfield contribution is more leveraged than a save that should not have been made. A nation can ride one hot goalkeeper a very long way — and the modern statistic that finally lets us say how far is post-shot expected goals.
Why goalkeeping matters more in a knockout
Football is a low-scoring sport, and the World Cup knockout stage is the lowest-scoring environment the game routinely produces. Teams that have survived a group are, by definition, hard to break down; managers tighten up; the cost of a mistake is elimination rather than a dropped point you can recover next week. The result is a steady diet of one-goal margins, extra time, and penalty shoot-outs. In that environment, the marginal value of preventing a goal is enormous, because goals are the scarce currency and there is no second leg in which to make one back.
This is the structural reason a goalkeeper can swing a tournament in a way a striker rarely does. A forward who creates and converts is wonderful, but a defence that concedes few clear chances limits how much that forward can even attempt. A goalkeeper, by contrast, has the final say on every shot that gets through — and in a tied knockout, every shot that gets through is potentially the whole match. The same logic that makes the penalty so brutal applies to the keeper across ninety minutes: one decisive moment, magnified by the absence of any other.
Post-shot xG: the lens that grades the keeper
For most of football history, the only public number on a goalkeeper was the save percentage — saves divided by shots on target. It is a deeply unfair statistic, because it treats a tame shot straight at the keeper and a top-corner rocket as identical events. A keeper who faced thirty soft efforts could post a gaudy save percentage while a keeper peppered with unstoppable shots looked ordinary. The number measured the defence in front of the goalkeeper at least as much as the goalkeeper.
Post-shot expected goals fixes this. As our explainer on post-shot xG and goalkeeper metrics sets out, PSxG waits until the ball is struck and then grades the shot on where it is actually heading and how hard it is travelling — the placement and pace the keeper has to deal with. A shot bound for the bottom corner at speed carries a high PSxG; a shot dribbling toward the keeper’s midriff carries a low one. Compare the PSxG of every shot a goalkeeper faced with the goals they actually conceded, and the gap is goals prevented: the cleanest single measure of shot-stopping the public game has.
The crucial property for tournament analysis is that PSxG strips out the defence. It does not reward a keeper for facing easy shots, nor punish one for facing hard ones; it asks only whether, given the difficulty of what arrived, they let in more or fewer than an average keeper would. Over a six-match run, a goalkeeper several goals to the good on that measure is the engine of a deep campaign, not a passenger on one.
The keepers who defined tournaments
The history of the World Cup is, in part, a history of goalkeepers having the fortnight of their lives. Gordon Banks’ save from Pelé’s downward header in 1970 is the most replayed stop in the sport precisely because it embodies the genre: a goal prevented that, by any reasonable expectation, should have been conceded. The modern viewer can now name what made it remarkable — a header from close range with a high post-shot value, somehow clawed away.
The pattern recurs every few editions. In 1990 a string of penalty saves carried sides through shoot-outs that the run of play had not decided. In 2002 South Korea’s march to the semi-finals leaned on a goalkeeper in inspired form behind a disciplined, deep defensive block. In 2014 the host nation’s campaign and several others turned on individual goalkeeping displays in tied knockouts, and the eventual champions were anchored by a keeper widely regarded as the tournament’s best. The recurring lesson is that goalkeeping is the position where a single hot run is most capable of overriding a talent gap elsewhere on the pitch.
A necessary honesty note: precise PSxG figures for older tournaments do not exist, because the shot-tracking data underpinning the metric was not collected for most of World Cup history. The famous saves are real and well documented; the exact numbers are not, and this article does not invent them. What can be said confidently is qualitative — these were high-difficulty stops in decisive moments — and that is the right altitude for facts the data cannot support.
The shoot-out within the tournament
If open-play goalkeeping is leveraged, the penalty shoot-out concentrates that leverage to its purest form. Here the goalkeeper is not one defender among several but a duellist, and a single save can end a nation’s tournament or extend it. Shoot-out reputations — keepers who studied takers, who saved at the decisive moment, who simply unsettled opponents from twelve yards — are a recurring World Cup subplot, and the broader history of those duels is its own subject in our look at World Cup shoot-outs.
The analytical caution is the same as for open play, only sharper: a shoot-out is a tiny sample. Three or four kicks faced is nowhere near enough to characterise a goalkeeper’s true penalty ability, and a keeper who is a hero one night may be beaten cleanly the next. The drama is genuine; the predictive signal is thin. Treating a single shoot-out as proof of a goalkeeper’s penalty mastery is exactly the small-sample trap that the analytical habits in our 2026 primer warn against.
What to watch for in 2026
The expanded 48-team field changes the front of the tournament but not its decisive back end. The group stage will feature more genuine mismatches, where a strong side’s goalkeeper is a spectator and a weaker side’s keeper faces a barrage. Those games inflate raw shot and save totals without telling us much. The honest signal — goals prevented against comparable opposition — will only begin to mean something in the round of 32 and beyond, once each surviving keeper has faced real chances from real contenders.
By the quarter-finals, the keepers still standing will each have several knockout matches behind them, and the goals-prevented ledger will start to separate genuine shot-stopping from a lucky night. Watch for the goalkeeper whose PSxG-minus-goals figure stays positive across rounds, not the one who made a single spectacular save on a highlight reel. In a tournament decided by one-goal margins, the nation with the keeper quietly stealing a goal a game is the one most likely to still be playing in July. A hot goalkeeper remains the cheapest route to a long World Cup — and now, for the first time, we can measure the heat.
The data behind this piece
- FBref — goalkeeping data including post-shot xG, goals against and shot-stopping for international matches.
- StatsBomb — methodology behind post-shot xG and goalkeeper evaluation, plus open shot-level data for recent World Cups.
- FIFA — official tournament records, match reports and historical World Cup archives.
- RSSSF — comprehensive historical results, including knockout scorelines and shoot-out records across every World Cup.
Post-shot xG and goalkeeper metrics
This section was first published on 16 April 2026 as a separate article.
Pre-shot xG tells you how dangerous a chance was before the ball was struck. It says nothing useful about the goalkeeper, because the goalkeeper hadn't touched it yet. Post-shot xG — PSxG — fixes that by waiting until the ball is in flight: it grades the shot on where it was heading and how hard it was travelling, then hands that probability to the keeper as the standard they were held to. The difference between that standard and the goals they actually let in is the closest thing we have to a clean goalkeeper metric.
Why pre-shot xG is the wrong tool for keepers
It feels like pre-shot xG should work as a goalkeeper benchmark. If a team's chances against you averaged 0.08 xG and you let in seven goals from eighty shots, that looks fine — you're on the right side of the numbers. The trouble is that on-target shots are not a representative sample of all shots. Strikers aim at corners, they pick their spots, they strike hard when they're in space. Everything that turns a 0.12 xG chance into a 0.22 xG chance — a clean strike, a disguised finish, a ball placed inside the post — happens after the pre-shot model is done with it.
The result is a systematic gap. Across the 64 matches of the 2022 World Cup, on-target shots carried a combined pre-shot xG of 112.1. Those same shots produced 187 goals — a ratio of 1.67. On-target shots beat their pre-shot xG by two-thirds, every single tournament. That gap isn't noise; it's the information pre-shot xG structurally discards. PSxG is the model that captures it.
What PSxG actually models
Post-shot expected goals is computed at the moment of contact. Where pre-shot xG asks "how good was this chance?", PSxG asks "given that the shot was on target, how likely is this specific ball to beat a keeper?" The key inputs shift from chance construction to shot execution:
- Shot placement. A shot hit into the top corner from twelve yards is harder to stop than the same shot hit at the keeper's hands. PSxG knows which it is.
- Shot speed and trajectory. Hard, low drives along the ground beat keepers more often than similarly-placed floaters. The best PSxG models — StatsBomb's included — incorporate shot pace and flight path where the data allows.
- Body part. A header into the bottom corner is a different save from a driven shot to the same spot. PSxG accounts for this separately from pre-shot xG.
- Keeper starting position. If the keeper is stranded or already committed in the wrong direction, PSxG can reflect that a technically saveable shot was realistically not.
The model is still a probability — PSxG of 0.74 means that among shots that looked exactly like this one, about three-quarters went in. But now "exactly like this one" includes the information that separates world-class keepers from league-average ones.
Goals prevented: the keeper's ledger
The output metric built on PSxG is called goals prevented (sometimes written as GA minus PSxG faced, or PSxG minus GA depending on sign convention). The arithmetic is simple:
Goals prevented = PSxG faced − Goals conceded
A keeper who faces shots totalling 8.0 PSxG and concedes six goals has prevented 2.0 — they outperformed what any average keeper would have managed. A keeper who faces the same 8.0 PSxG but lets in ten has cost their team 2.0 goals relative to average. Over a season, these numbers accumulate into the clearest single-number verdict on shot-stopping we have.
The pre-shot equivalent — xG conceded minus goals conceded — is a weaker signal precisely because of that 1.67 ratio. France's goalkeeper at the 2022 World Cup faced on-target shots worth just 8.0 pre-shot xG, yet conceded 12 goals — catastrophic in pre-shot terms. In PSxG terms those twelve goals need to be assessed against the PSxG of the shots actually faced, not the pre-shot xG of every chance. The metrics measure different things.
The 2022 World Cup sample
The chart below plots pre-shot xG faced (on-target only) against goals conceded for the four semi-final teams. It illustrates the core problem directly.
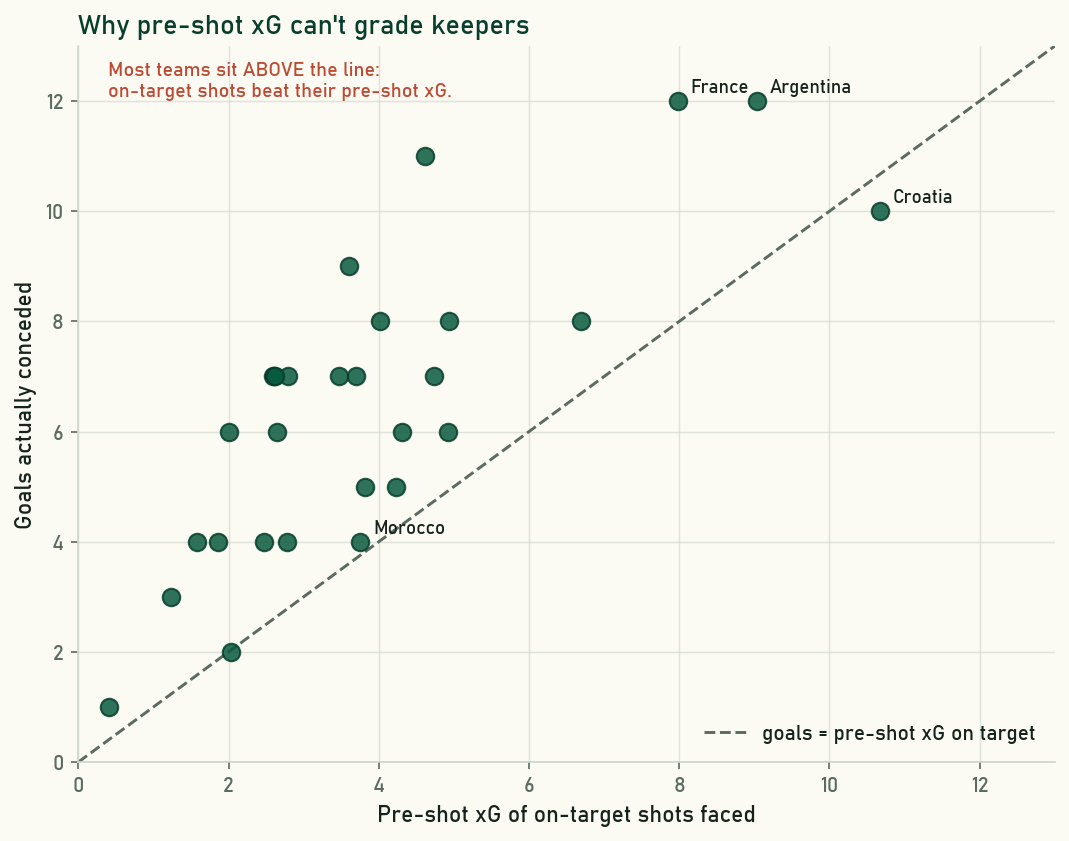
The y=x line is the theoretical "fair" outcome if pre-shot xG perfectly predicted on-target goals. Almost every team sits above it. That is not a coincidence and not a fluke in one season's data — it is the structural undershoot built into pre-shot xG when applied only to the on-target sample.
| Team | Pre-shot xG faced (on target) | Goals conceded | Ratio |
|---|---|---|---|
| Croatia | 10.7 | 10 | 0.93 |
| Argentina | 9.0 | 12 | 1.33 |
| France | 8.0 | 12 | 1.50 |
| Morocco | 3.8 | 4 | 1.05 |
Morocco's defence was exceptional by pre-shot standards — just 3.8 pre-shot xG of on-target attempts across seven matches. But that cannot tell you whether Yassine Bounou was outstanding or merely well-protected; for that you need PSxG. Croatia's Dominik Livaković faced 10.7 pre-shot xG and conceded 10, a ratio below 1.0 and the only semi-finalist on the right side of that line. These numbers hint at the story; PSxG would finish it.
Computing PSxG: what you actually need
True PSxG requires shot-placement data that is not in most public datasets — specifically, where the ball was heading in the goal frame at the moment of contact. StatsBomb's event data provides shot_end_location as a three-element vector (x, y, z), which is enough. Most other freely available datasets do not carry it, so if you're working outside StatsBomb, you're limited to on-target conversion rates by distance and angle band — a meaningful step above raw pre-shot xG, but not the real thing.
With StatsBomb open data and Python:
from statsbombpy import sb
import pandas as pd

# Fetch all 2022 World Cup events
comps = sb.competitions()
season = comps[(comps.competition_id == 43) & (comps.season_name == "2022")].iloc[0]
matches = sb.matches(competition_id=43, season_id=int(season.season_id))

all_shots = []
for _, match in matches.iterrows():
    events = sb.events(match_id=int(match.match_id))
    shots = events[events.type == "Shot"].copy()
    all_shots.append(shots)

shots = pd.concat(all_shots, ignore_index=True)

# On-target shots only: outcome is 'Saved', 'Goal', or 'Saved Off Target'
on_target = shots[shots.shot_outcome.isin(["Saved", "Goal", "Saved Off Target"])]

# shot_end_location is [x, y, z] — y and z encode placement in the goal frame
on_target = on_target.copy()
on_target["end_y"] = on_target["shot_end_location"].apply(
    lambda v: v[1] if isinstance(v, list) and len(v) >= 2 else None
)
on_target["end_z"] = on_target["shot_end_location"].apply(
    lambda v: v[2] if isinstance(v, list) and len(v) >= 3 else None
)
on_target["is_goal"] = on_target["shot_outcome"] == "Goal"

print(on_target[["shot_statsbomb_xg", "end_y", "end_z", "is_goal"]].head())
From here, train a logistic regression or gradient-boosted model on end_y, end_z, body part, and shot speed (if available) with is_goal as the target. Evaluated on each on-target shot, that model's output is your PSxG. PSxG faced − goals conceded gives goals prevented per keeper.
What PSxG still can't tell you
Goals prevented is a better goalkeeper metric than anything built on pre-shot xG, but three caveats are worth keeping front and centre.
Rebounds. If a keeper parries rather than holds, the model counts that as a success — a 0.7 PSxG shot did not become a goal from the original attempt. The rebound is a separate event with its own (usually high) PSxG. Most implementations treat them independently, which can flatter keepers who palm into danger rather than holding.
Defenders. A central defender who deflects a shot from the near-side of the goal to the far post has changed the PSxG of the eventual attempt. If the keeper saves the redirected ball, they're being credited for a harder save than the striker intended. Disentangling keeper merit from outfield positioning is a genuine unsolved problem at the publicly available data level.
Sample size. A goalkeeper at a major international tournament might face fifty on-target shots across a whole competition. The goals prevented metric has a confidence interval around it that most published league tables pretend does not exist. A difference of two goals prevented over a season could easily be noise. The metric is most meaningful when accumulated over many seasons with a consistent team shape, or when the difference is large enough to survive the uncertainty.
Where these numbers come from
- StatsBomb open data — the shot-level data including
shot_end_locationandshot_statsbomb_xgused throughout this article. - StatsBomb — documentation on their PSxG model and goalkeeper metrics in their commercial data offering.
- FBref — publishes PSxG and goals prevented for keepers across major leagues (Opta-sourced).
- Understat — xG tables for the major European leagues, useful context for the pre-shot baseline.
More from World Cup 2026
The 2026 Dark-Horse Audit: Grading Our June Checklist
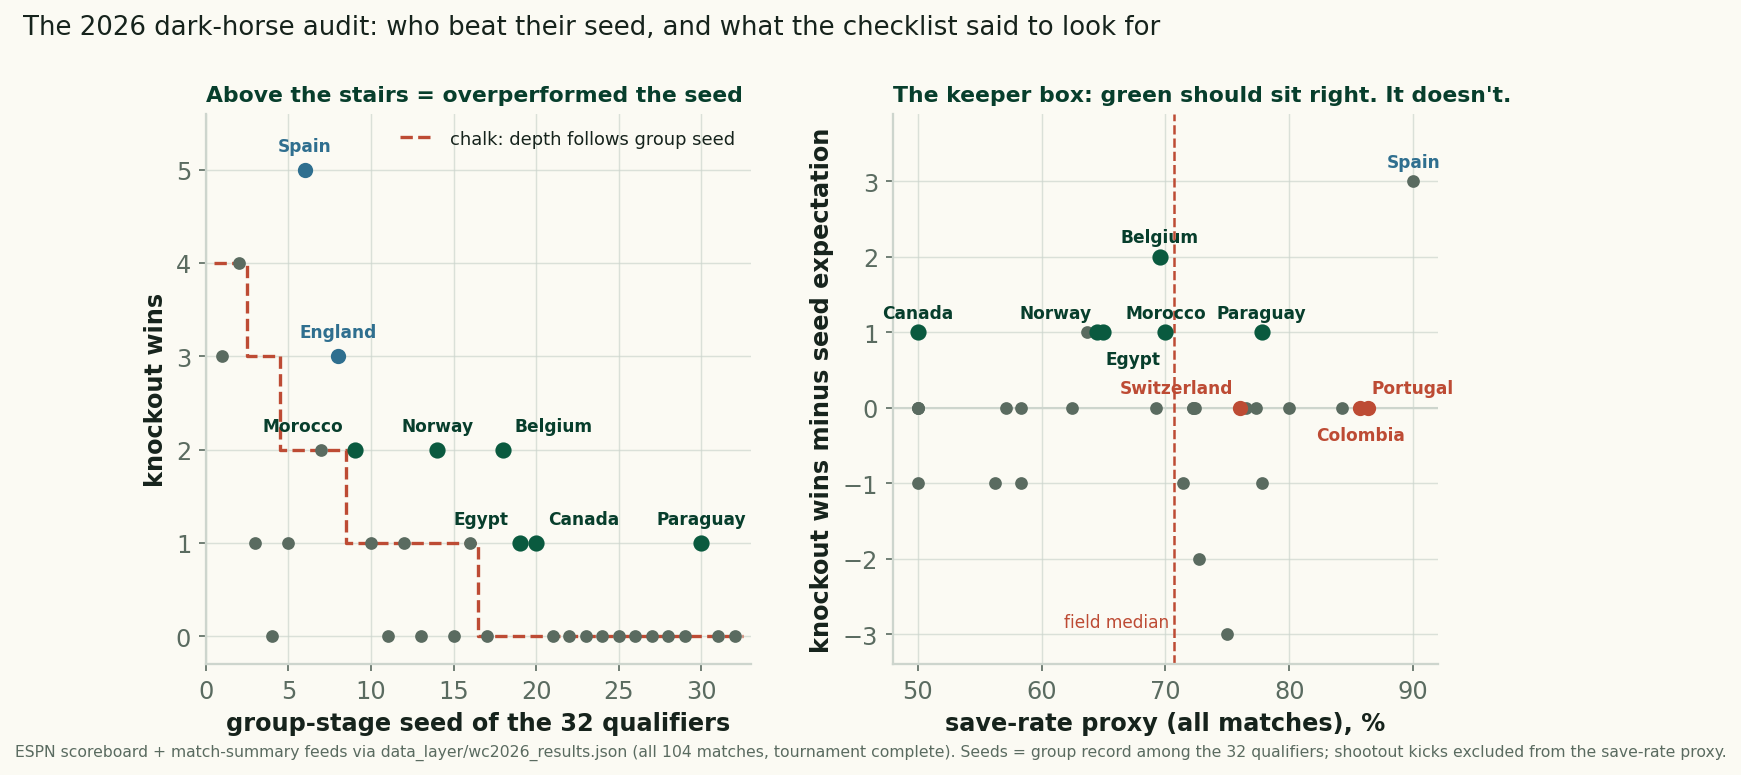
Six teams beat their group seed at the 2026 World Cup, scored against our pre-tournament checklist: the keeper box failed, the kind draw barely helped.
The Shootouts: Rarer, Earlier, and a Reprieve That Never Lasted
Retro #4 closes the series: the shootout rate fell to 12.5% of knockout games from 2022's 31%, all four came early, and survivors went 1-3 next time out.
The Groups Told the Truth: How June Predicted July at the 2026 World Cup
Group-stage points strongly predicted knockout survival: 9-point teams went 3-for-3, 4-point teams 2-for-11, and the last four all ranked top-8.