Where World Cup Players Aim: The Goal-Mouth Map of 2022's Goals
52% of goals went in low, and the bottom corners were the deadliest zones of all. Where scorers actually put the ball, mapped onto the goal frame.
“Pick your spot” is the oldest advice in finishing, and the 2022 World Cup shows exactly which spots scorers pick. StatsBomb records where every shot crossed the goal line — how far across the goal and how high — so we can map all 152 non-penalty goals onto the goal frame itself. The pattern is unmistakable: goals pile into the corners, and the bottom corners above all. The two bottom-corner zones alone accounted for 12% and 14% of goals, while the dead center of the goal — where the goalkeeper is standing — is nearly empty. 52% of all goals were placed low.
Sourcing. Every figure is computed from StatsBomb's free, public 2022 World Cup data — the recorded end-location (across-goal position and height) of each goal-scoring shot. Penalties are excluded throughout. Nothing is from memory or invented.
The exhibit: a keeper's-eye view
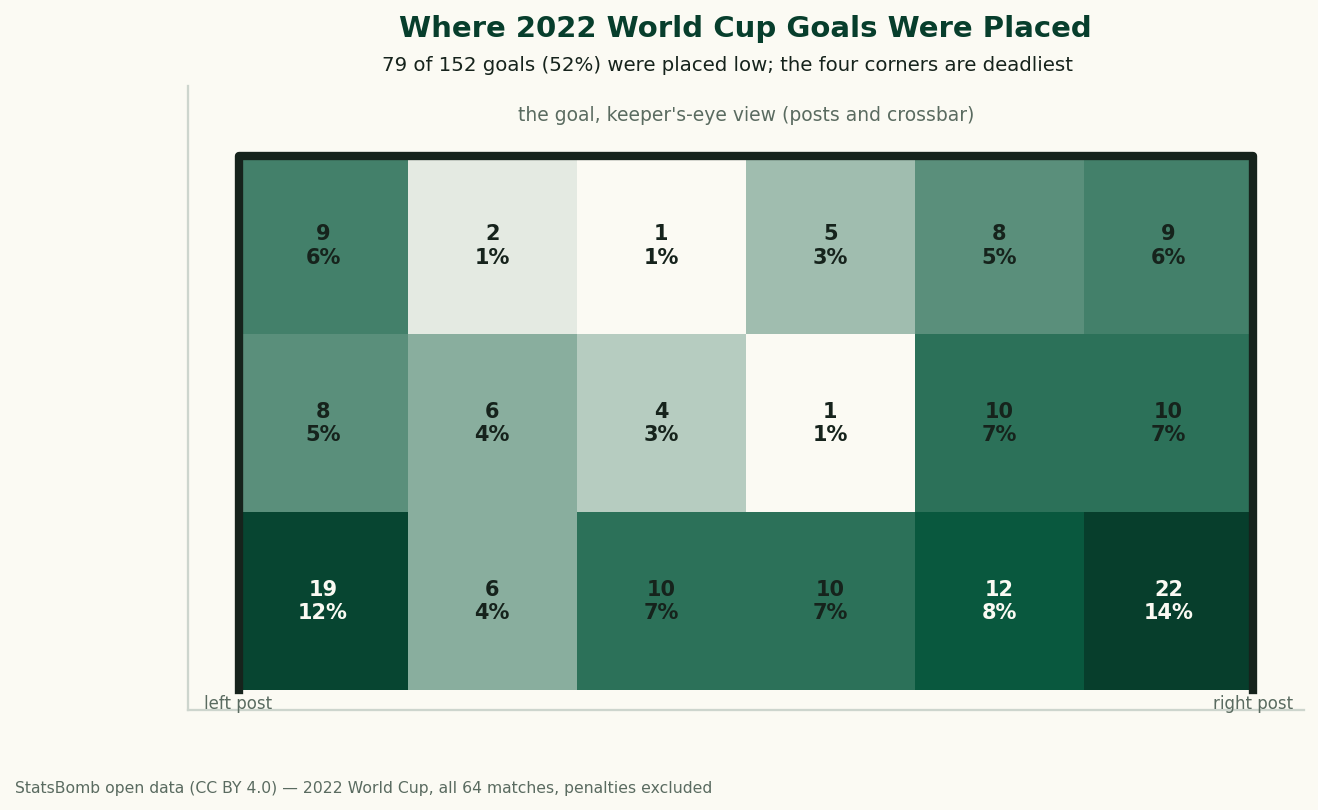
Read it like a target. The darkest cells — the two bottom corners — are where finishing concentrates: 19 goals (12%) in one corner, 22 (14%) in the other. The entire bottom row is busy, the corners at every height draw goals, and the middle of the frame is a near-vacuum: the central-middle zone took in just one goal (1%) all tournament. The goal is eight yards wide and the keeper can only be in one place — and scorers relentlessly target the places he isn't.
Why low and to the corner
The corners are obvious — they're farthest from the keeper, who starts central — but the “low” preference is the subtler, more important truth. Three forces push shots downward:
- A low shot is harder to save. A keeper has to get down to ground level, a longer and slower movement than reaching up, and his hands are usually carried higher than his feet. The bottom corner is the single hardest spot to reach.
- Low shots stay on target. Blaze a shot high and a miss sails over the bar for nothing; keep it low and even a mishit tends to stay between the posts and under the crossbar. Aiming low shrinks the cost of an error.
- Most chances invite it. Tap-ins, cut-backs, and close-range finishes — the bulk of goals, as the shot-location map shows — are naturally struck along the ground.
Put together, the bottom corner is the percentage play: hardest to save, safest to miss toward, and the spot most chances set up. The top corners are spectacular and do draw goals, but they're the high-risk, high-reward option, not the bread and butter.
A worked example: the keeper's dilemma
Imagine you're the goalkeeper facing a one-on-one. The map says the shooter is most likely going low and to a corner — so do you commit early to a side and dive low, risking being wrong-footed, or stay big and central and concede the corners? There's no clean answer, which is exactly why finishing works: the shooter holds the information and the keeper must guess. The near-empty center of the chart is the keeper's one consolation — almost nobody beats a set keeper straight down the middle, so standing tall denies the easiest miss. Everything else is a duel the data says the shooter usually wins when the placement is good. To feel how a handful of well-placed, high-quality chances swing a match, try the explorer below.
This explorer needs JavaScript. It models shootout and placement odds, so you can see how aiming for the corners trades save-probability against the risk of missing the target entirely.
The honest caveats
- End-location is where it crossed the line, not the aim point. A deflected or scuffed shot is recorded where it ended up, which isn't always where the striker intended — so this is where goals land, a close but imperfect proxy for where players aim.
- Survivorship: these are goals only. We map shots that went in, not all attempts, so the chart shows where finishing succeeds, not the full distribution of where players shoot (many corner-bound shots are saved or miss).
- Penalties excluded. Penalty placement is its own distinct pattern (and convert ~75%); including them would over-weight the corners further.
- Coarse zones. Six-by-three cells smooth over finer placement; the corners are deadliest, but the exact hottest pixel shifts with the binning.
The takeaway
The goal frame is not used evenly — World Cup scorers hunt the corners and, above all, the deck. Keeping it low and wide is the percentage finish: hardest to save, safest to mishit, and the natural product of most chances. The dead center, where the keeper stands, is essentially off-limits. For the strikers and keepers in the 2026 tournament it's the same geometry it has always been — pick the corner, keep it down. For where these chances are created, see where goals are scored from; for the keeper's side of the duel, post-shot xG and goalkeeping.
Reproduce it
From data_layer/wc2022_shots.json, take the non-penalty goals' end_y (across the goal, posts at 36 and 44) and end_z (height, crossbar ~2.67), clip to the frame, and bin into a 6×3 grid. Count goals per zone and color. The chart is drawn by charts/chart_wc2022_placement.py. No network at build time, nothing hand-entered.
Sources & further reading
- Free textbook: Chapter 7: Expected Goals (xG) Models — the theory behind this, at DataField.dev.
- Shot end-location data: StatsBomb open data (CC BY 4.0), FIFA World Cup 2022, all 64 matches, bundled as
data_layer/wc2022_shots.json. Data provided by StatsBomb. - Companion: where goals are scored from · when goals are scored · how goals originate.
- Keeper side: post-shot xG & goalkeeper metrics · the World Cup hub.
More from Data Deep-Dives
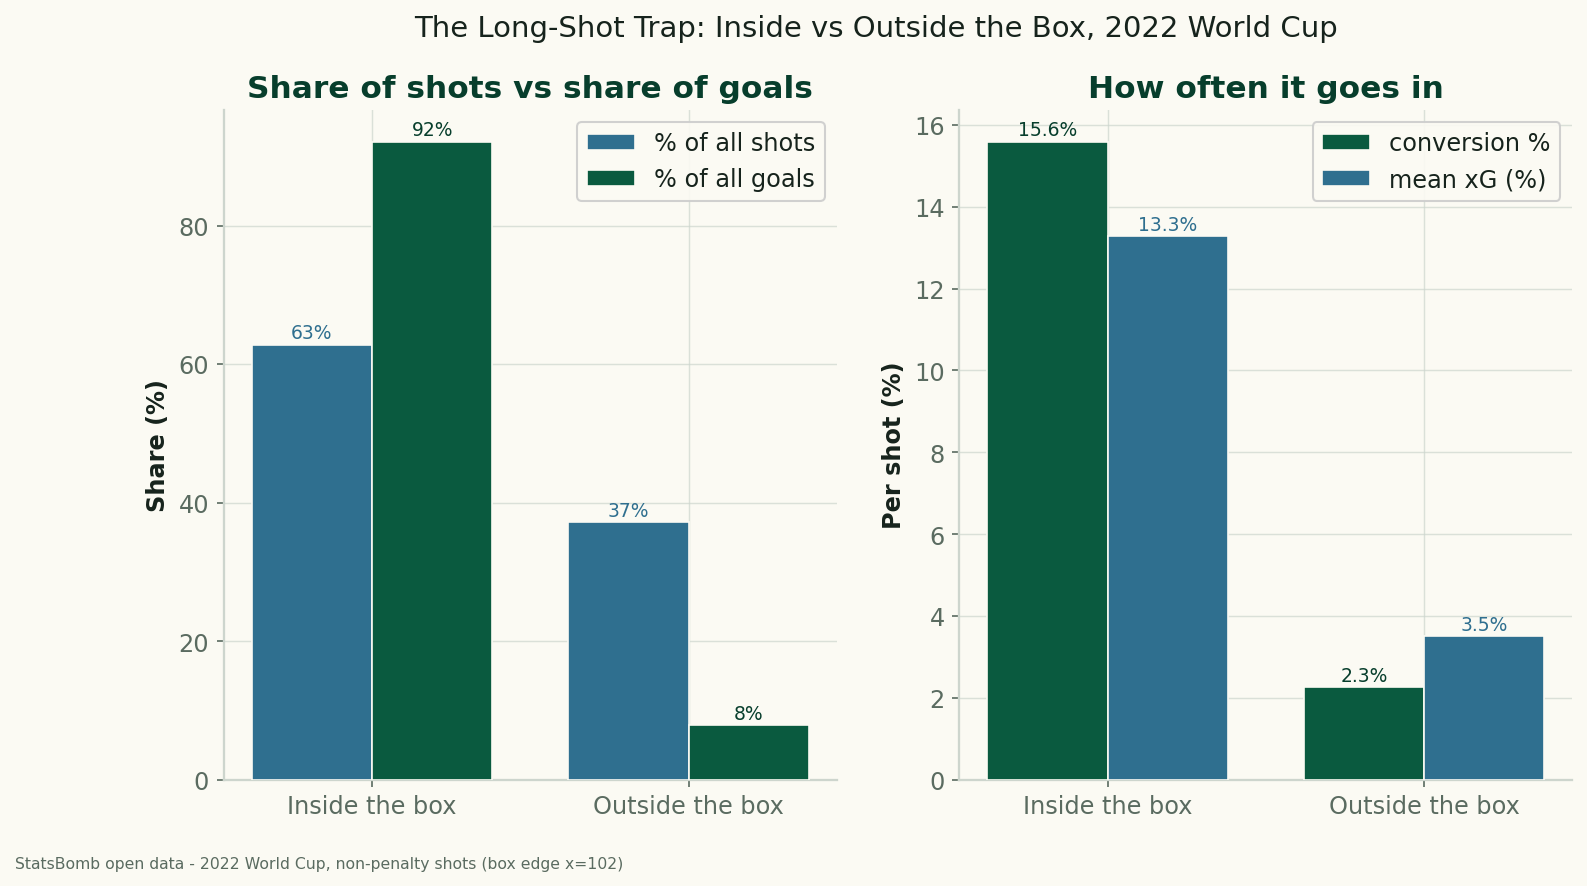
The Long-Shot Trap: Inside vs Outside the Box at the 2022 World Cup
Using StatsBomb data for all 64 matches of the 2022 World Cup, shots from outside the penalty box were 37% of all attempts but produced just 8% of the goals — a 2.3% conversion rate against 15.6% from inside. The data behind 'stop shooting from there.'
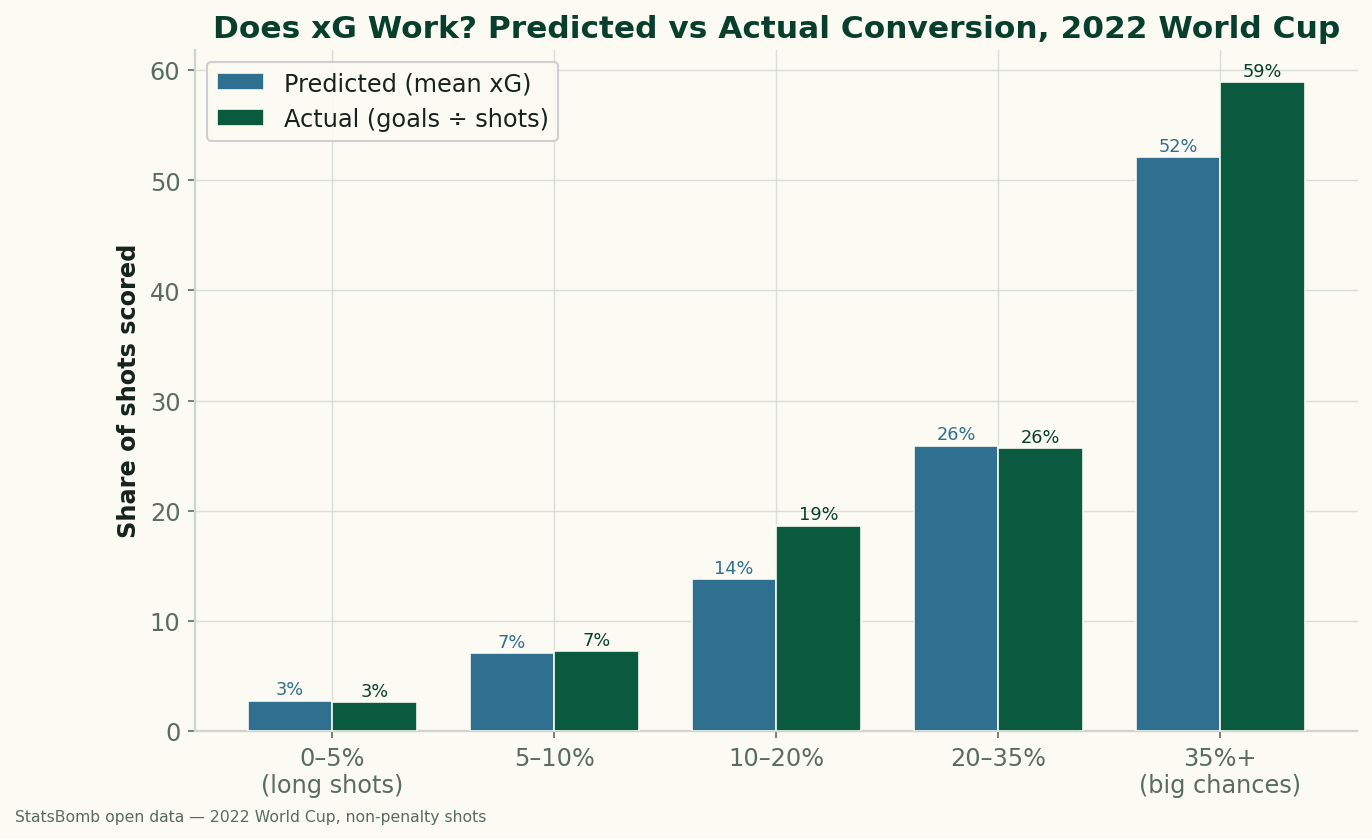
Does xG Actually Work? Big Chances vs Long Shots at the 2022 World Cup
We sorted every non-penalty shot from the 2022 World Cup by its expected-goals value and checked how often each band actually went in. xG holds up well: a 0–5% shot scored 2.6% of the time, a 'big chance' of 35%+ went in 58.9%. The calibration, and what a big chance is really worth.
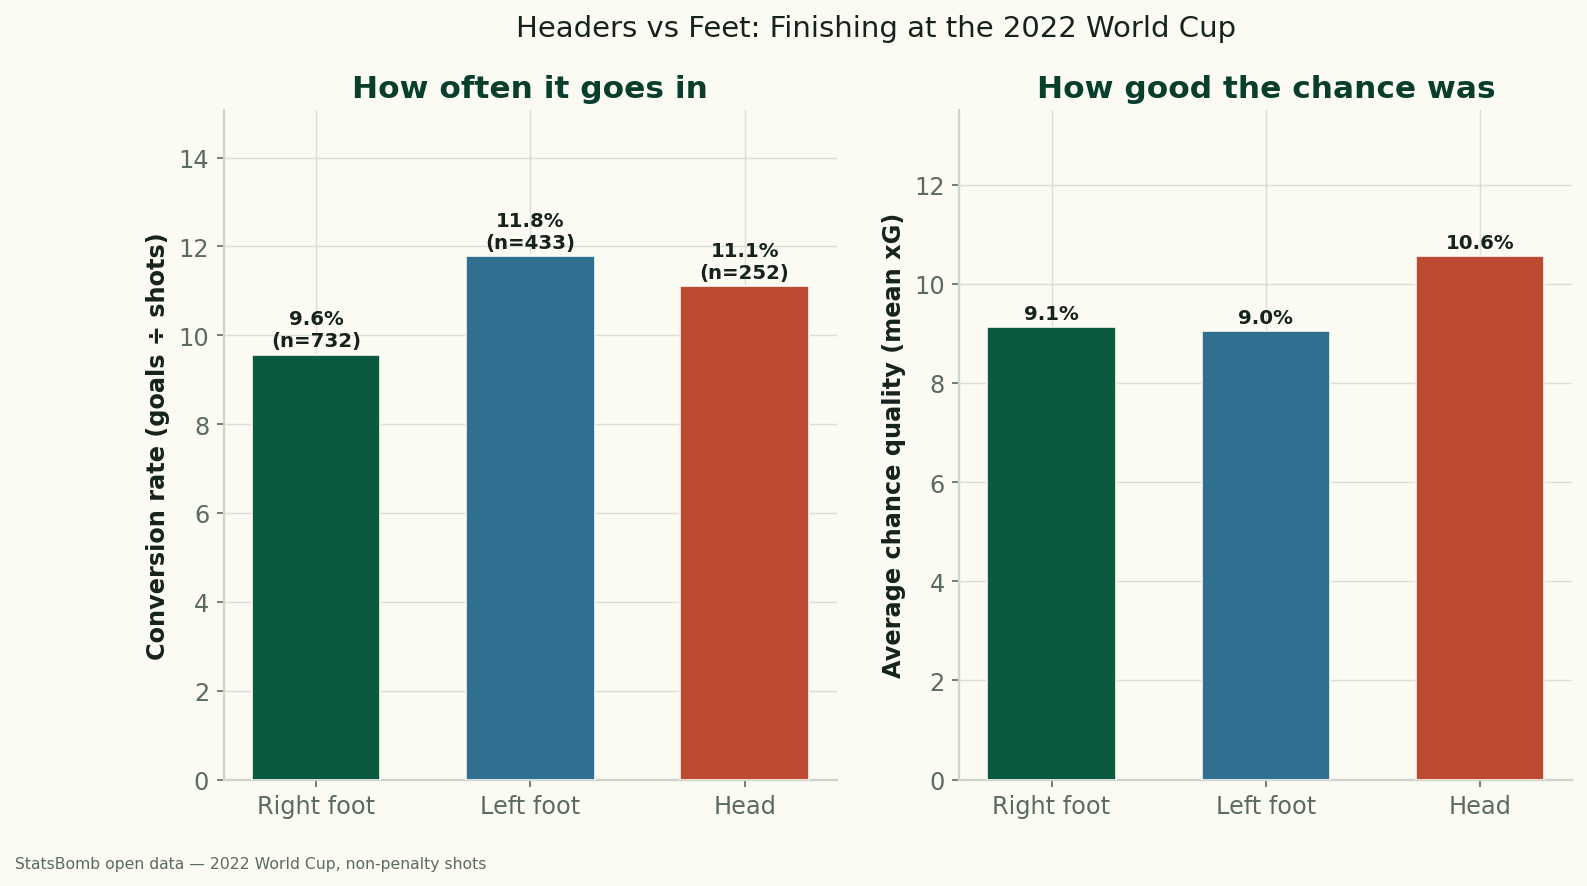
Headers vs. Feet: Which World Cup Shots Actually Go In?
Using StatsBomb data for all 64 matches of the 2022 World Cup, headers and feet convert at almost the same rate (11.1% vs 10.5%) — but only because headers come from higher-quality positions. Relative to chance quality, foot finishing beat the model, and the left foot was the most clinical of all.