Discipline and Defeat: The 2026 World Cup's Cards and Fouls So Far
Losers average more cards than winners. Coincidence, or does indiscipline cost you?
Cards and fouls are the part of a match we remember emotionally and measure rarely. So here is the discipline picture of the 2026 World Cup through 32 completed matches, from the real match data: an average of 2.4 yellow cards and 22.8 fouls per game, with 7 red cards across the tournament so far. And one pattern jumps out of the numbers — the teams that lose are the teams that get carded most. Whether that's cause or symptom is the interesting question.
Sourcing. Every figure is from the 32 completed matches only, pulled from ESPN's public match-summary feed and retrieved June 21, 2026. Completed games only; no projections; nothing invented.
The baseline: how chippy has it been?
Across the completed games, teams are committing about 11.4 fouls each (22.8 a match) and collecting 1.2 yellow cards each (2.4 a match), with seven reds total — roughly one every four or five games. That's a moderately-officiated tournament: not a card-happy one, but not a free-for-all either. The single chippiest match so far was United States 2–0 Australia, which alone produced seven cards.
The pattern: losers get carded more
Split every team's game by how it ended — won, drew, or lost — and average the cards, and a clean gradient appears.
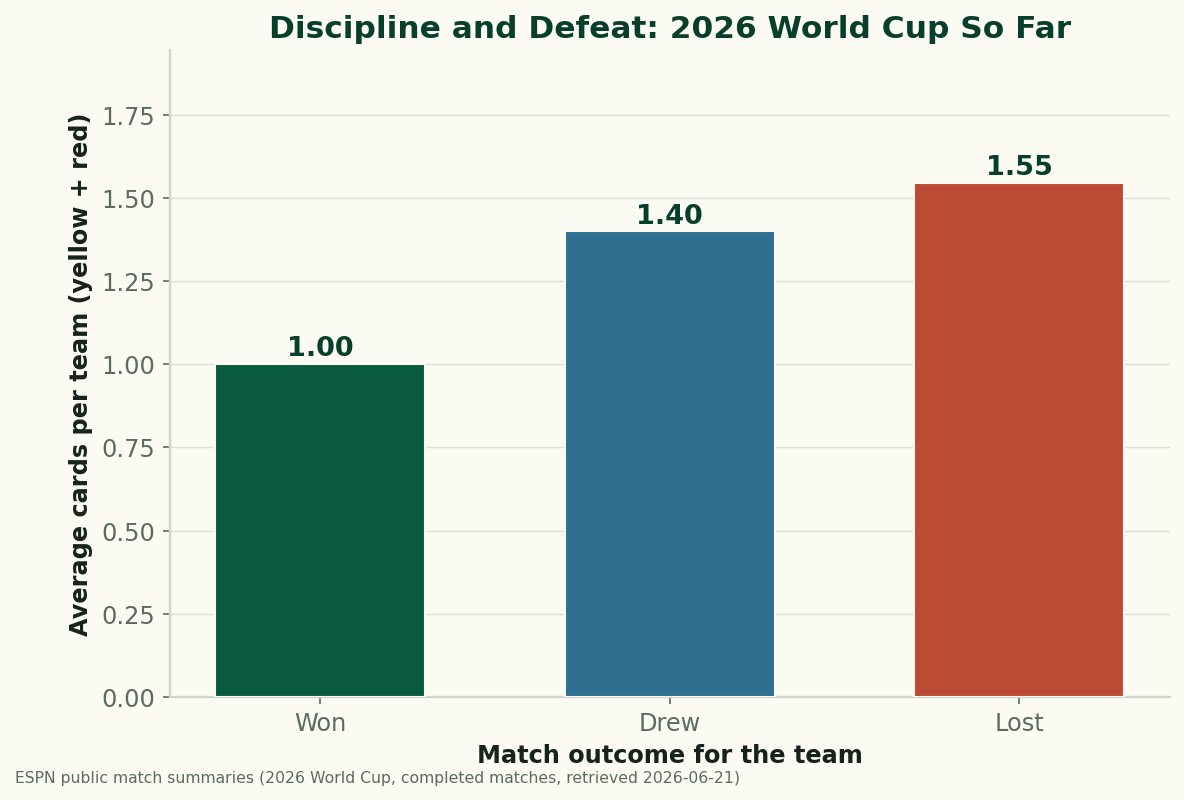
Winners averaged 1.00 card, teams that drew 1.40, and losers 1.55. The losing side picks up more than half a card more than the winning side, on average — and the drawing teams sit neatly in between. Fouls follow the same direction but more faintly (losers 12.1 to winners 11.4). The discipline ledger and the scoreboard point the same way.
Cause, symptom, or both?
It's tempting to read this as “indiscipline costs you the game,” and there's a real mechanism for that: a needless booking changes how a player defends, a second yellow or a red leaves a team short-handed, and conceding cheap fouls hands the opponent set pieces. A red card in particular is one of the biggest single swings in football. So some of the gap is genuinely causal — cards make losing more likely.
But most of it is probably the other direction: losing causes cards. The team that's behind chases the game, lunges into tackles it wouldn't make while level, and fouls out of frustration and necessity late on. The team that's ahead sits back, keeps its shape, and has less reason to dive in. So a chunk of the “losers get carded more” effect is simply that being behind produces rash challenges — the same game-state effect that distorts possession and shot numbers. The honest reading is that cards and defeat reinforce each other, and a single tournament's data can't cleanly split the two.
Why the rate matters for reading a match
A 2.4-cards-per-game tournament tells you something about how it's being refereed: relatively permissive, letting play flow, which tends to favor technical, possession-based teams over those who rely on tactical fouling to break up rhythm. When you watch a game, the foul count is a quiet indicator of which way the contest is tilting — a team racking up fouls is usually a team chasing the ball, and now you know it's also, on average, a team trending toward a loss.
The limits of this snapshot
- Small sample, group stage only. Thirty-two games and seven reds is not much to generalize from; the 1.00-vs-1.55 gap is real in this data but will move as more matches are played. Treat it as “through 32 games.”
- Correlation, not a verdict. The data cannot tell you how much of the cards-and-losing link is cards causing losses versus losing causing cards. Both are happening; the split is unknowable from results alone.
- Cards aren't all equal. A red card and a yellow are bundled here as “cards,” but a sending-off is far more consequential than a booking. A finer analysis would weight them and track when in the match they came.
- One source, and refereeing varies. Card and foul counts come from a single public feed, and officiating standards differ by referee and confederation, which adds noise no single-tournament average removes.
The takeaway
The 2026 World Cup has been moderately disciplined — about two and a half yellows and twenty-three fouls a game — and within that, the losing teams are reliably the more-carded ones. It's the rare stat where the causation genuinely runs both ways: indiscipline nudges you toward defeat, and defeat drags you into indiscipline. Either way, when you see a team's foul count climbing, the scoreboard is usually about to agree.
Reproduce it
Each completed match in data_layer/wc2026_results.json carries both teams' yellow cards, red cards, and fouls (from the ESPN match-summary feed). Split team-games by outcome (won/drew/lost) and average the cards in each. The chart is drawn by charts/chart_wc2026_discipline.py. No network at build time, nothing hand-entered.
Sources & further reading
- Free textbook: Chapter 12: Defensive Metrics and Analysis — the theory behind this, at DataField.dev.
- 2026 per-match discipline data: bundled
data_layer/wc2026_results.json— ESPN public match-summary feed, 32 completed matches, retrieved 2026-06-21. Charted bycharts/chart_wc2026_discipline.py. - Companion: What actually wins games at the 2026 World Cup and more draws and more blowouts.
- Background: Game state effects on stats — why trailing teams foul more.
- Background: Defensive actions: tackles and interceptions — the legal side of breaking up play.
More from World Cup 2026
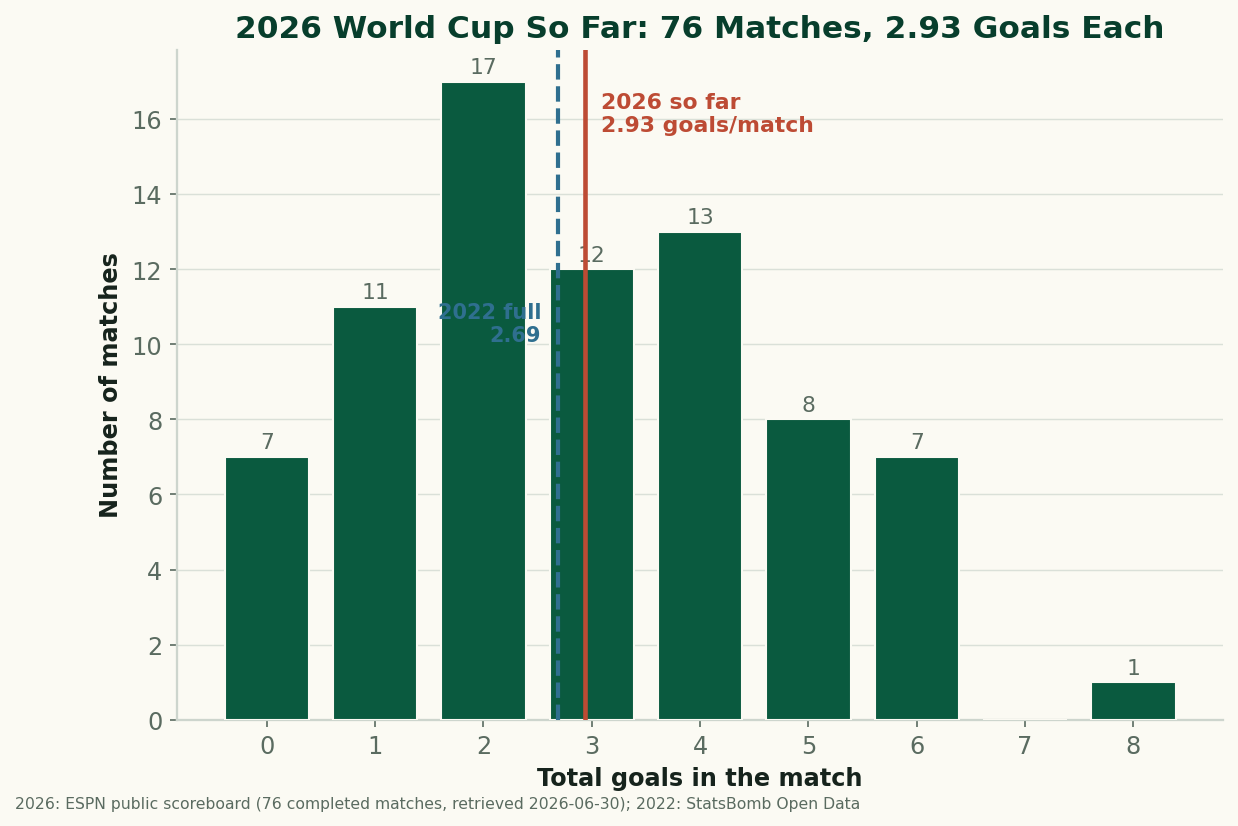
The 2026 World Cup So Far, By the Numbers: Just Under 3 Goals a Game
Through 76 completed matches, the 2026 World Cup is still outscoring 2022 — 2.93 goals a game to 2.69. After an early spike the rate has settled just under 3 a game. The real, sourced numbers on goals, draws, and the blowouts behind them, with honest caveats about a group-stage-only sample. (A living snapshot, refreshed as games are played.)
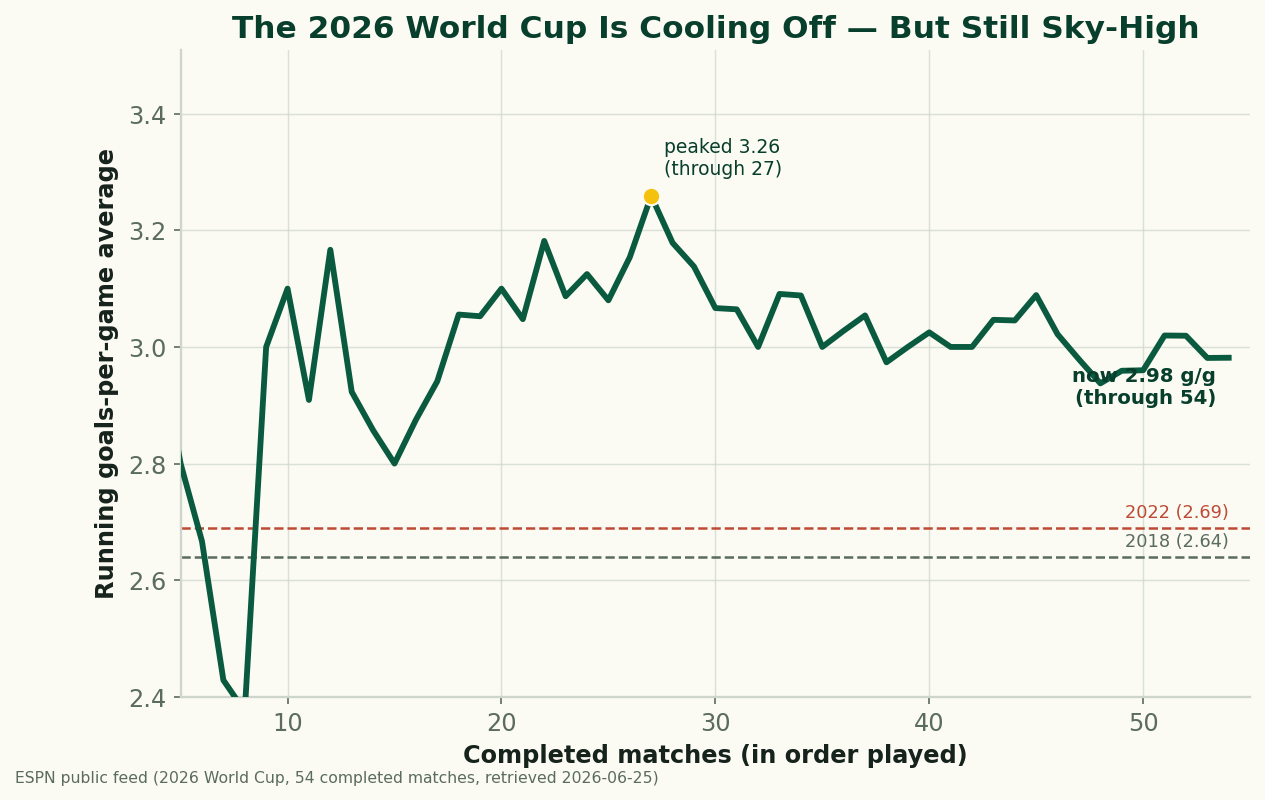
The 2026 World Cup Is Cooling Off — and Still the Highest-Scoring in Generations
Through 54 completed matches, the 2026 World Cup is averaging 2.98 goals a game — down from a blistering 3.26 early on, but still comfortably above 2022 (2.69) and 2018 (2.64), and the highest-scoring World Cup since 1970. A refreshed look at where the goals are going as the group stage closes.
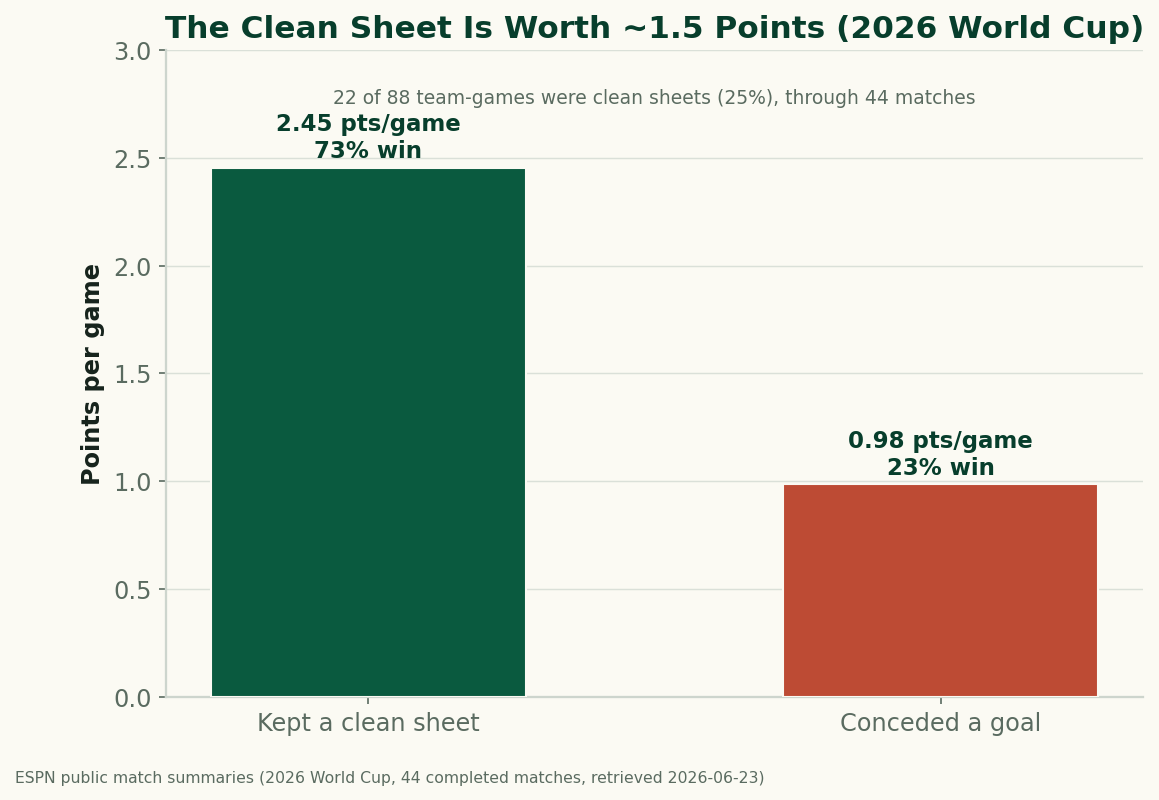
The Clean Sheet Is the Most Valuable Thing at the 2026 World Cup
Through 44 completed matches, a team that keeps a clean sheet at the 2026 World Cup averages 2.45 points and wins 73% of the time; a team that concedes averages under 1. Don't concede and you almost can't lose — the data on what a clean sheet is worth.