More Draws and More Blowouts: The 2026 World Cup Is More Polarized Than 2022
The expanded field is producing more of both extremes — stalemates and routs — and fewer normal close wins.
A bigger World Cup was always going to mean a wider range of teams — and the early data shows exactly that, in a shape worth naming. Through 32 completed matches, the 2026 World Cup isn’t simply higher- or lower-scoring than 2022. It’s more polarized: more draws and more blowouts, with the comfortable-but-competitive middle squeezed from both sides. The expanded 48-team field is producing more stalemates between similar teams and more routs of the mismatches, and fewer of the ordinary one- and two-goal wins that used to be the tournament’s bread and butter.
Sourcing. All 2026 figures are from the 32 completed matches only, pulled from ESPN’s public results feed and retrieved June 20, 2026; the 2022 comparison uses the bundled StatsBomb results for all 64 games. Completed matches only, no projections, nothing invented.
Three kinds of result
Sort every match into one of three buckets by its goal margin: a draw, a close win (decided by one or two goals), or a blowout (three or more). Then compare how the 2026 games so far split against the full 2022 tournament.
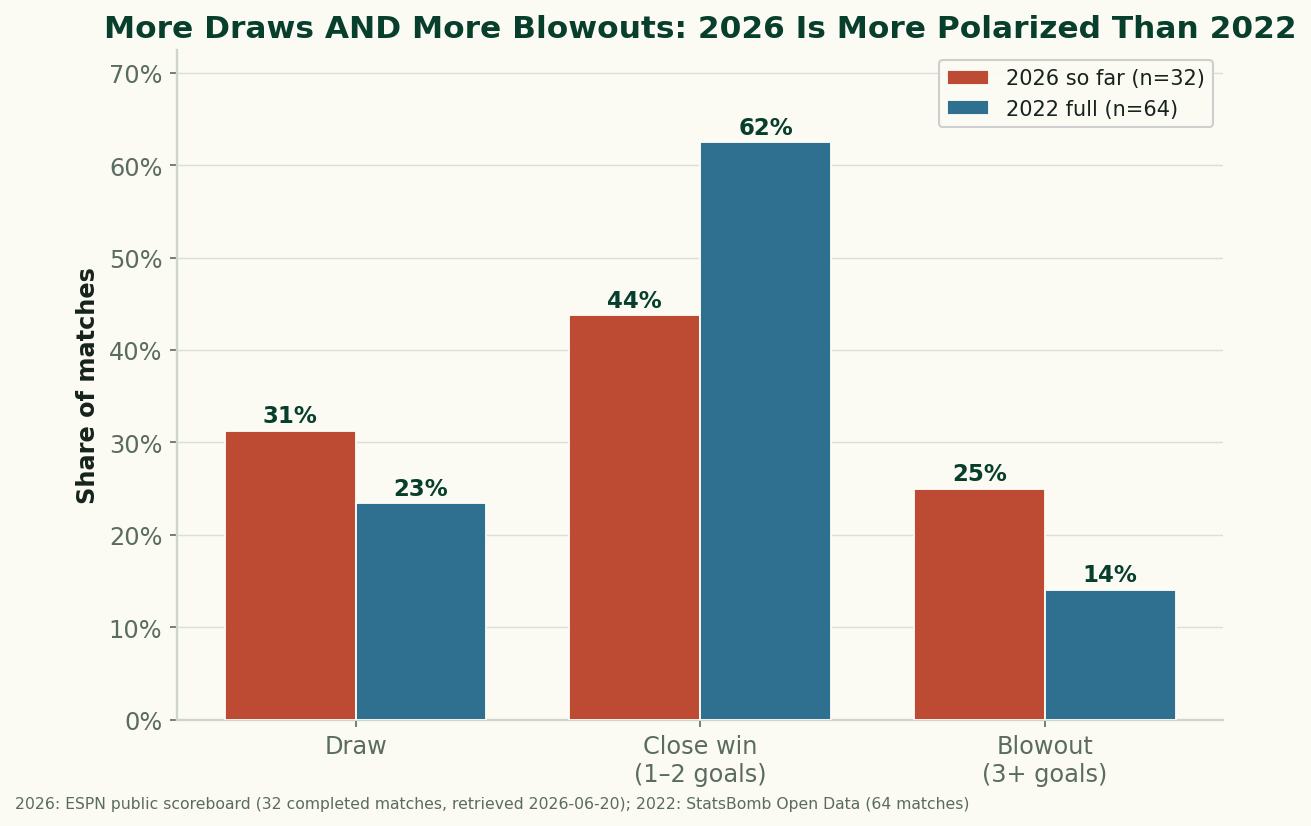
The numbers are clean. Draws: 31% in 2026 against 23% in 2022. Blowouts: 25% against 14% — nearly double the rate of three-plus-goal margins. And the close-win middle collapsed from 62% of 2022’s games to just 44% so far. Both tails of the distribution grew at the expense of the center. That’s the statistical signature of polarization: not a shift in the average, but a spreading-out.
Why a bigger field pulls the results apart
This is the expanded format doing exactly what you’d expect. A 48-team World Cup admits a wider range of quality than a 32-team one — more debutants and lower-ranked sides alongside the traditional powers. That wider range shows up at both ends:
- The mismatches produce blowouts. When a heavyweight draws a debutant, the expected margin is large, and the early group games are where those lopsided pairings concentrate. The result is the crop of three-, four-, and six-goal wins inflating the blowout share.
- The well-matched games produce draws. Among teams of similar level — and there are now more of them clustered in the middle tier — group-stage caution and fine margins push a lot of games to a level finish. Nine of the ten draws so far had goals (mostly 1–1); these aren’t dead games, they’re tight ones.
The squeezed middle is the flip side: fewer games feature a clear-but-not-overwhelming favorite grinding out a one- or two-goal win, because the field has fewer of those evenly-but-not-equally matched pairings and more of the extremes.
It reconciles the earlier “higher scoring” story
This also sharpens what I wrote when the tournament had played 29 games: that 2026 was outscoring 2022. With 32 games in, the goals-per-match average has eased to about 3.0 (from 3.14), drifting toward 2022’s 2.69 as predicted — but the polarization is the more durable finding. The higher early scoring was never about every game being open; it was largely those blowouts. A distribution with fat tails on both ends can have a higher mean (the routs pull it up) while also having more draws (which pull it down). Polarization, not a uniform goal surge, is what the 48-team field actually changed.
Why it’s still early — and what to watch
- Small, group-stage-only sample. Thirty-two games is under a third of the tournament, and these are disproportionately first-round games, where mismatches are most common. As weak teams are eliminated, the blowout share should fall — the surviving games are between better-matched sides.
- Draws may fall too, for the opposite reason. The knockouts can’t end level in 90 minutes; extra time and penalties force a result. So both tails should compress as the tournament advances — the polarization is itself partly a group-stage phenomenon.
- One source, scores only. Result type is about as verifiable as data gets, but it’s a blunt lens: a 1–1 thriller and a goalless bore are both “draws,” and margin says nothing about chance quality (the expected-goals story is separate).
- 2022 is one benchmark. Comparing to a single prior tournament is suggestive, not definitive; a multi-tournament baseline would firm up whether 31% draws and 25% blowouts are genuinely high.
The takeaway
The headline number to watch at this World Cup isn’t the goals-per-game average — it’s the spread. Through 32 games, 2026 is delivering more draws and more blowouts than 2022 and fewer normal close wins, the polarization a wider 48-team field naturally creates. Expect both tails to shrink as the minnows go home and the knockouts force results, but for now the defining feature of the 2026 group stage is that its matches are landing at the extremes. I’ll refresh this as more are played.
Reproduce it
Classify each match in data_layer/wc2026_results.json (ESPN, completed games only) and wc2022_matches.json by goal margin into draw / close (1–2) / blowout (3+), and compare the shares. The chart is drawn by charts/chart_wc2026_result_types.py. No network at build time, nothing hand-entered.
Sources & further reading
- Free textbook: Chapter 5: Introduction to Soccer Metrics — the theory behind this, at DataField.dev.
- 2026 results: bundled
data_layer/wc2026_results.json— ESPN public scoreboard feed, 32 completed matches, retrieved 2026-06-20. Charted bycharts/chart_wc2026_result_types.py. - 2022 comparison: bundled
data_layer/wc2022_matches.json— StatsBomb Open Data (CC BY-NC-SA 4.0), all 64 matches. - Companion: The 2026 World Cup so far, by the numbers and what actually wins games.
- Context: Why the World Cup expanded to 48 and will 48 teams mean more upsets?
More from World Cup 2026
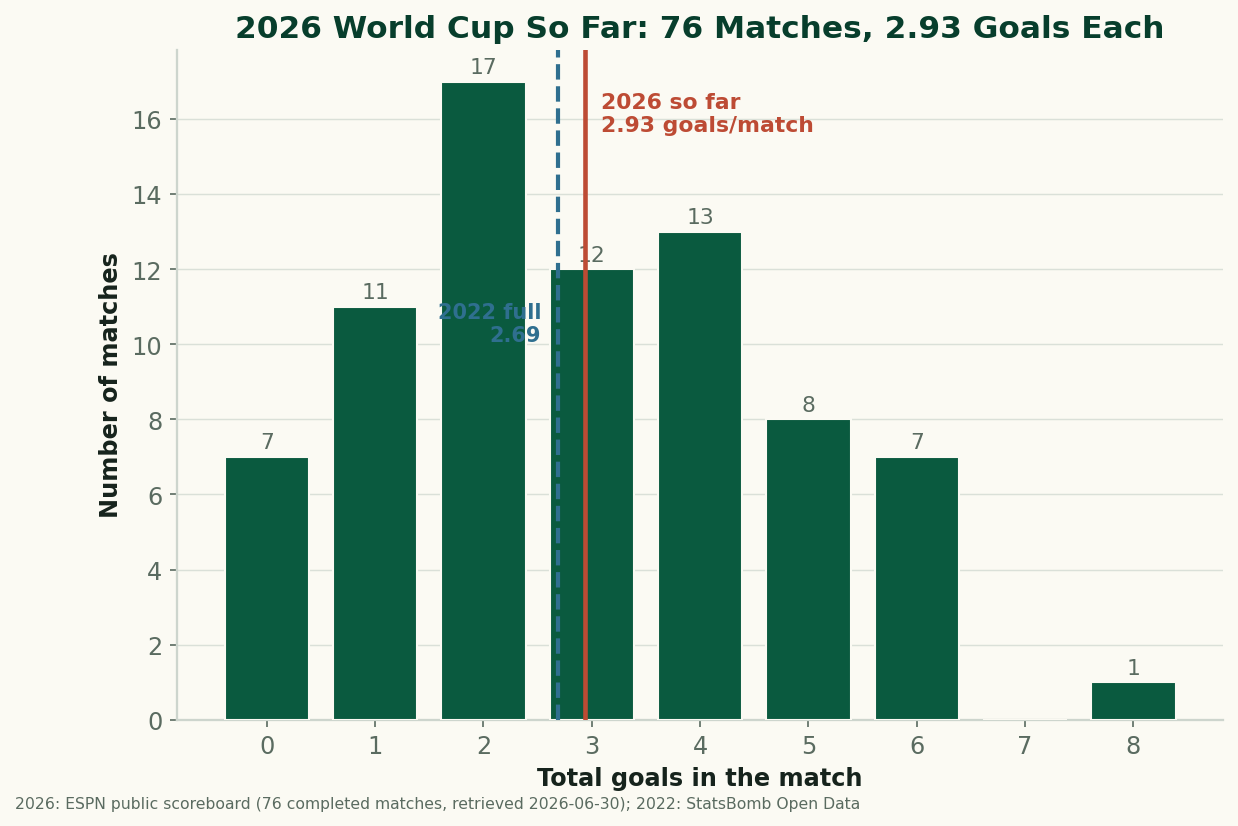
The 2026 World Cup So Far, By the Numbers: Just Under 3 Goals a Game
Through 76 completed matches, the 2026 World Cup is still outscoring 2022 — 2.93 goals a game to 2.69. After an early spike the rate has settled just under 3 a game. The real, sourced numbers on goals, draws, and the blowouts behind them, with honest caveats about a group-stage-only sample. (A living snapshot, refreshed as games are played.)
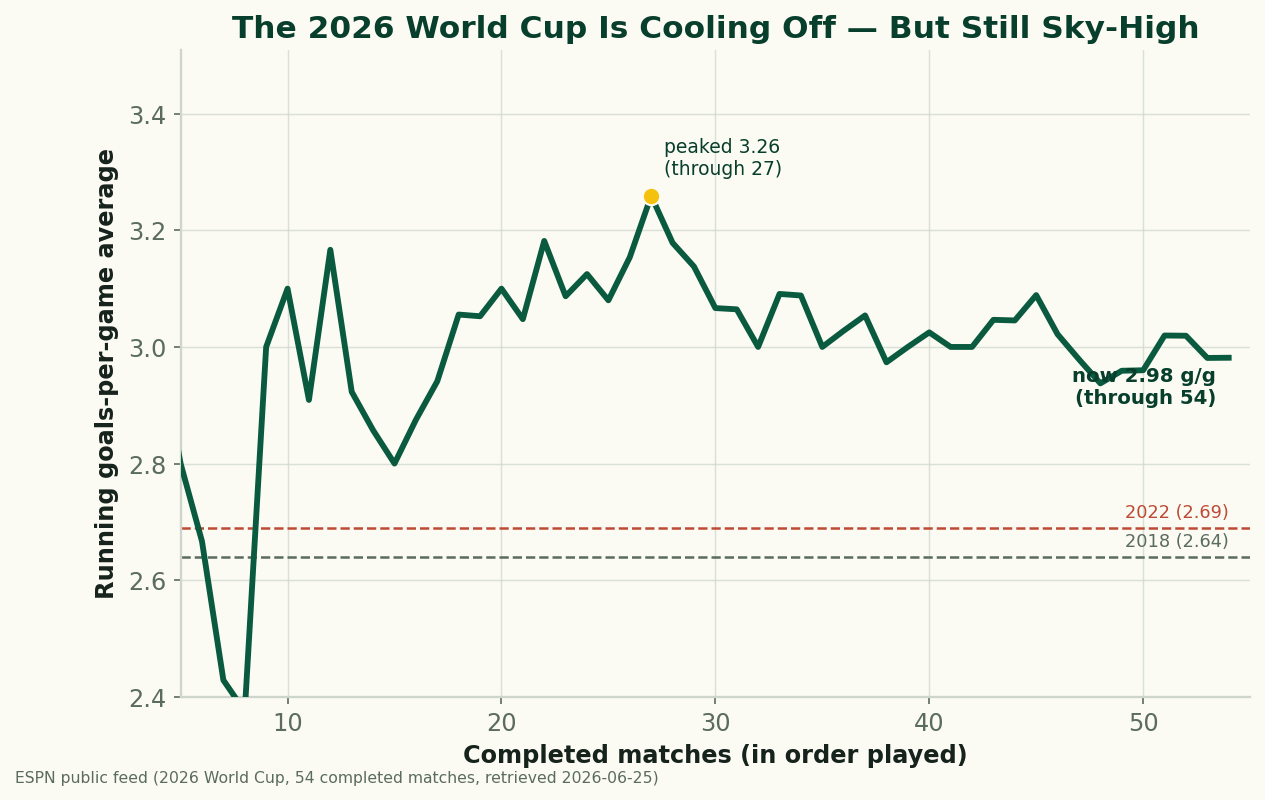
The 2026 World Cup Is Cooling Off — and Still the Highest-Scoring in Generations
Through 54 completed matches, the 2026 World Cup is averaging 2.98 goals a game — down from a blistering 3.26 early on, but still comfortably above 2022 (2.69) and 2018 (2.64), and the highest-scoring World Cup since 1970. A refreshed look at where the goals are going as the group stage closes.
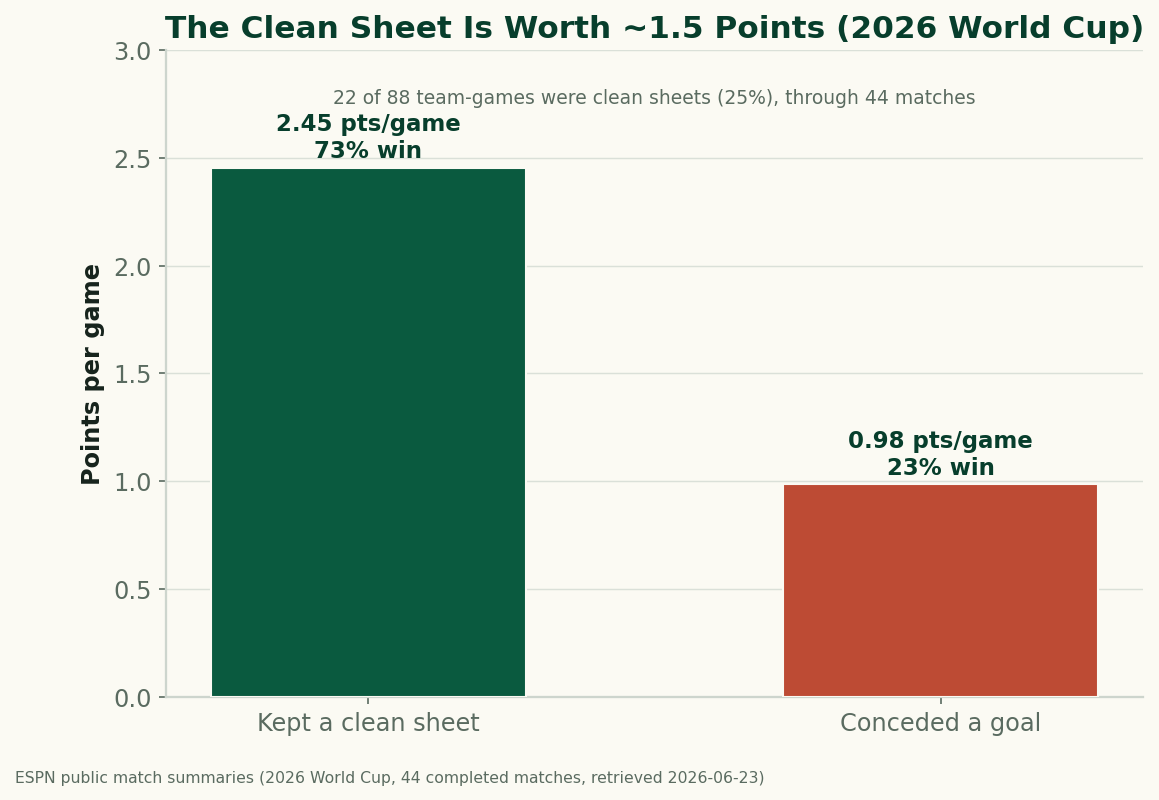
The Clean Sheet Is the Most Valuable Thing at the 2026 World Cup
Through 44 completed matches, a team that keeps a clean sheet at the 2026 World Cup averages 2.45 points and wins 73% of the time; a team that concedes averages under 1. Don't concede and you almost can't lose — the data on what a clean sheet is worth.