Clinical or Wasteful? Shot Conversion at the 2026 World Cup
A third of shots on target score. The teams way above and below that line are mostly riding variance.
Finishing is the most over-narrated skill in football: one tournament and a striker is either “clinical” or “can't hit a barn door.” The data lets us be precise. Through 41 completed matches at the 2026 World Cup, teams have converted about 35% of their shots on target into goals — roughly one in three. Around that tournament average sit some eye-popping team extremes: the United States and Japan have buried 75% of their shots on target, while Ecuador have hit the target 16 times and scored zero. The fun part is that almost none of those extremes mean what they appear to.
Sourcing. Every figure is from the 41 completed matches only, from ESPN's public match-summary feed, retrieved June 22, 2026. Completed games only; no projections; nothing invented. (A dated snapshot — the tournament is ongoing.)
The baseline: about a third of shots on target score
The robust number here is the tournament-wide rate: 123 goals from 346 shots on target, a 35.5% conversion rate. That's the gravity every team is being pulled toward. It's a useful anchor — when a commentator says a team “should have scored more,” the honest benchmark is roughly one goal per three shots on target, not one per shot.
The exhibit: goals vs. shots on target
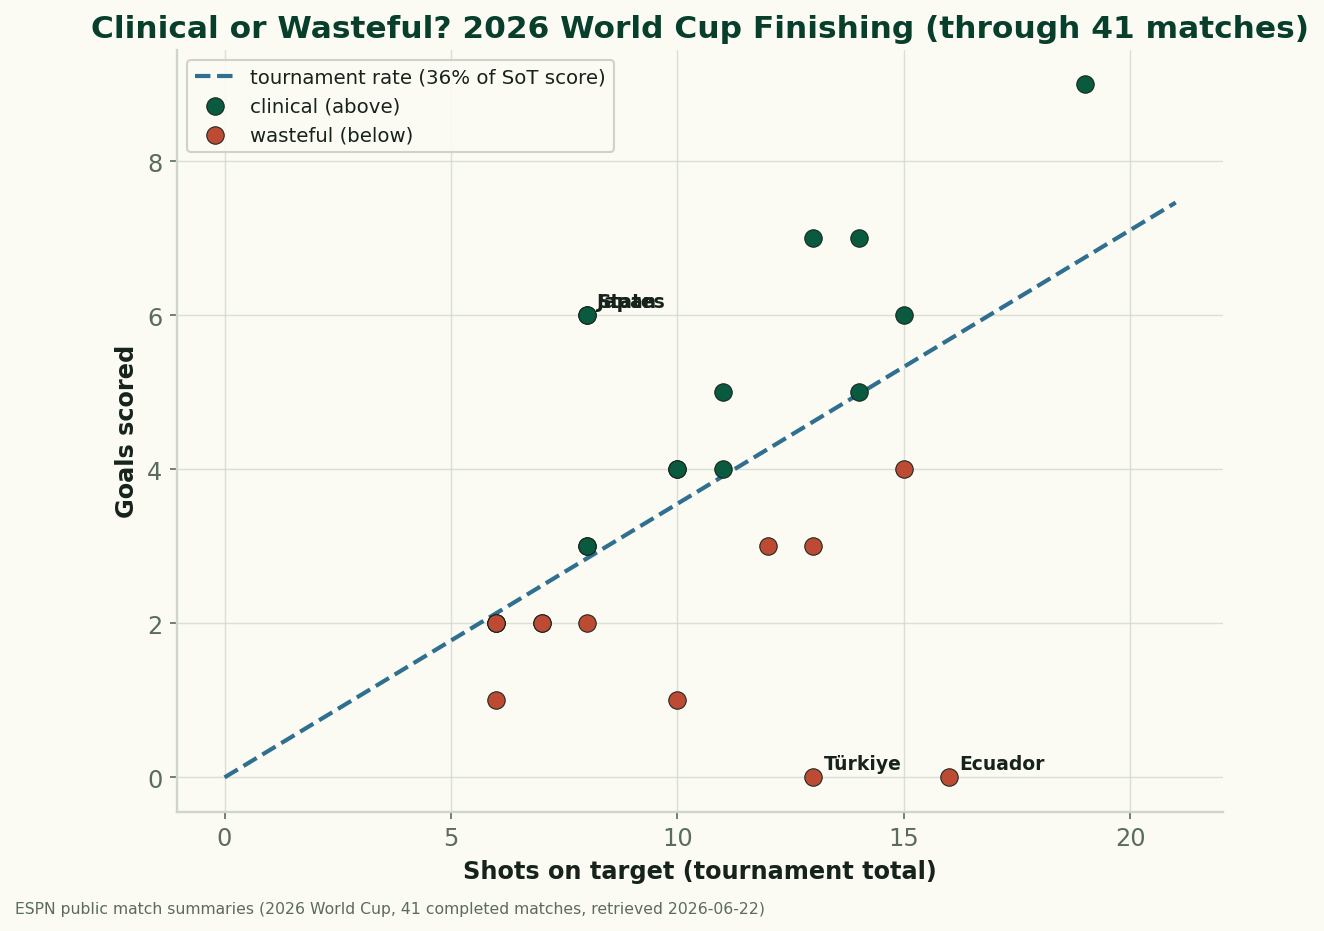
The vertical spread around that line looks dramatic. The USA (6 goals from 8 shots on target) and Japan (6 from 8) sit far above it; Belgium (1 from 10), Türkiye (0 from 13), and especially Ecuador (0 from 16) sit far below. Read naively, that's the difference between a deadly attack and a toothless one. Read correctly, it's mostly variance.
Why these extremes are (mostly) luck
Here's the crucial caveat, and it's the real lesson of the piece. Each team has played only three or four games, so these conversion rates rest on a handful of shots — and finishing is one of the noisiest things in football over small samples. A 75% conversion rate over 8 shots is what you'd expect from an average team having a hot week, not proof of elite finishing. And Ecuador going 0-for-16 is almost certainly brutal luck rather than a genuine inability to score: at the tournament's 35% rate, you'd expect about five or six goals from 16 shots on target, and getting zero is a tail outcome that will correct.
The tell is regression. If finishing were a stable team skill, these rates would persist; instead, the teams at the extremes now are overwhelmingly likely to drift back toward 35% in their next games. That's why analysts trust expected goals over raw conversion: xG measures the quality of chances created, which is far more repeatable than the percentage that happen to go in over a few matches. A team generating good chances but not converting (hello, Ecuador) is usually a team about to score a bunch, not a cursed one.
What it does and doesn't tell you
So is finishing skill real at all? Yes — but it's a small, slow-to-confirm effect that needs hundreds of shots to detect, not a dozen. Over a single World Cup, the conversion table is dominated by luck, and the right way to use it is backwards: treat the over-performers as due to cool off and the under-performers as due to heat up. The team that “can't finish” through three games is, more often than not, simply a team whose shots haven't fallen yet.
The limits of this snapshot
- Tiny samples per team. Three-to-four games and single-digit-to-teens shots on target make every team rate wildly imprecise. Only the tournament-wide 35.5% is on firm ground; the team extremes are illustrative, not verdicts.
- Shots on target is a coarse denominator. A tap-in and a 30-yard screamer both count as one shot on target, but convert at completely different rates. Real finishing analysis uses post-shot xG, which weights each shot by how likely it was to score.
- It ignores the goalkeeper. A low conversion rate is partly the opponent's keeper, not just the shooter — a saved shot on target is a save as much as a miss.
- One source, ongoing tournament. Counts come from a single public feed and this is a moving target; the numbers will shift as more matches are played.
The takeaway
The 2026 World Cup is converting shots on target at about 35% — a clean benchmark worth remembering. The teams sitting far above or below it after three games aren't clinical or cursed; they're early and small-sample. If you want to know who'll score going forward, don't look at who has scored their chances — look at who's creating them. Conversion regresses; chance creation sticks.
Reproduce it
For each team in data_layer/wc2026_results.json, total goals and shots on target across its completed games; the tournament rate is total goals over total shots on target. The chart plots each team against the tournament line. Regenerated by charts/chart_wc2026_finishing.py. No network at build time, nothing hand-entered.
Sources & further reading
- Free textbook: Chapter 7: Expected Goals (xG) Models — the theory behind this, at DataField.dev.
- 2026 per-match shot data: bundled
data_layer/wc2026_results.json— ESPN public match-summary feed, 41 completed matches, retrieved 2026-06-22. Charted bycharts/chart_wc2026_finishing.py. - Background: Expected goals explained — why chance quality is more repeatable than conversion.
- Background: Post-shot xG and goalkeeper metrics — separating the shooter from the keeper.
- Companion: What actually wins games at the 2026 World Cup.
More from World Cup 2026
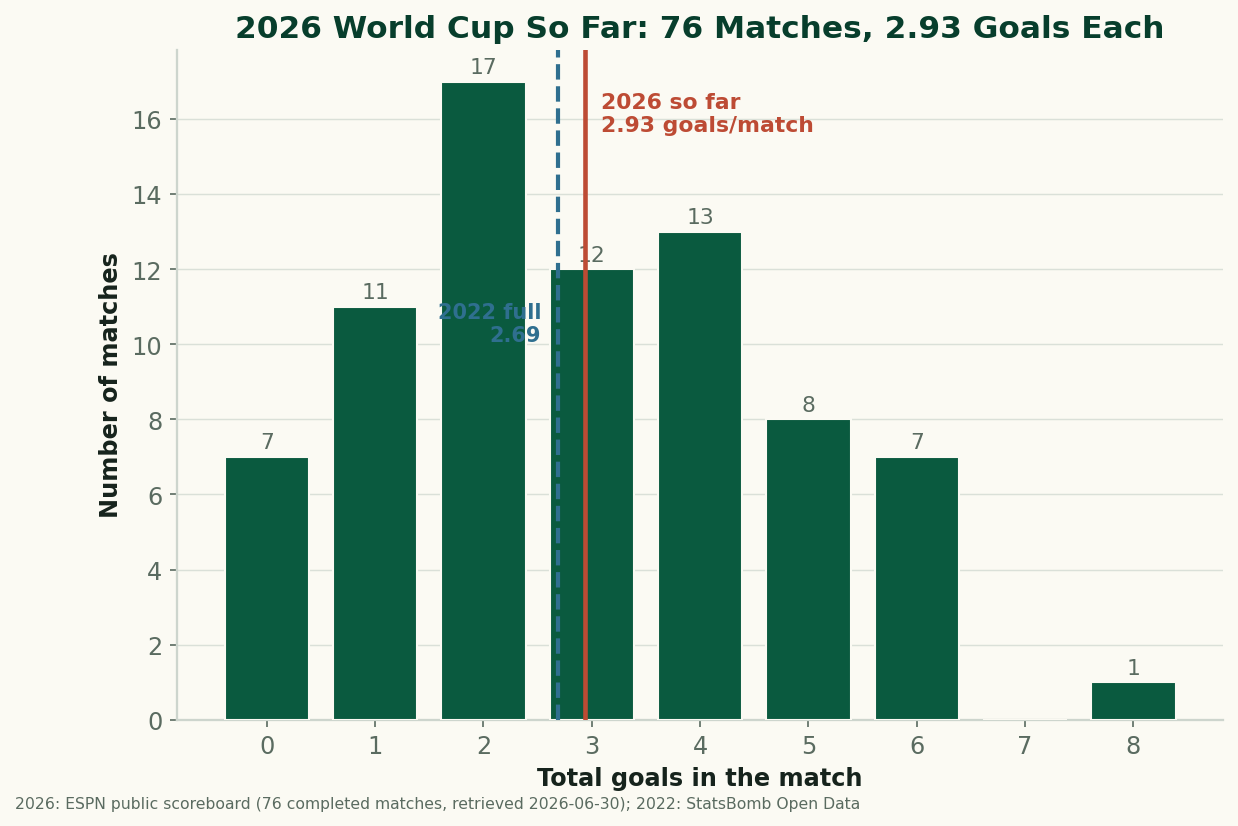
The 2026 World Cup So Far, By the Numbers: Just Under 3 Goals a Game
Through 76 completed matches, the 2026 World Cup is still outscoring 2022 — 2.93 goals a game to 2.69. After an early spike the rate has settled just under 3 a game. The real, sourced numbers on goals, draws, and the blowouts behind them, with honest caveats about a group-stage-only sample. (A living snapshot, refreshed as games are played.)
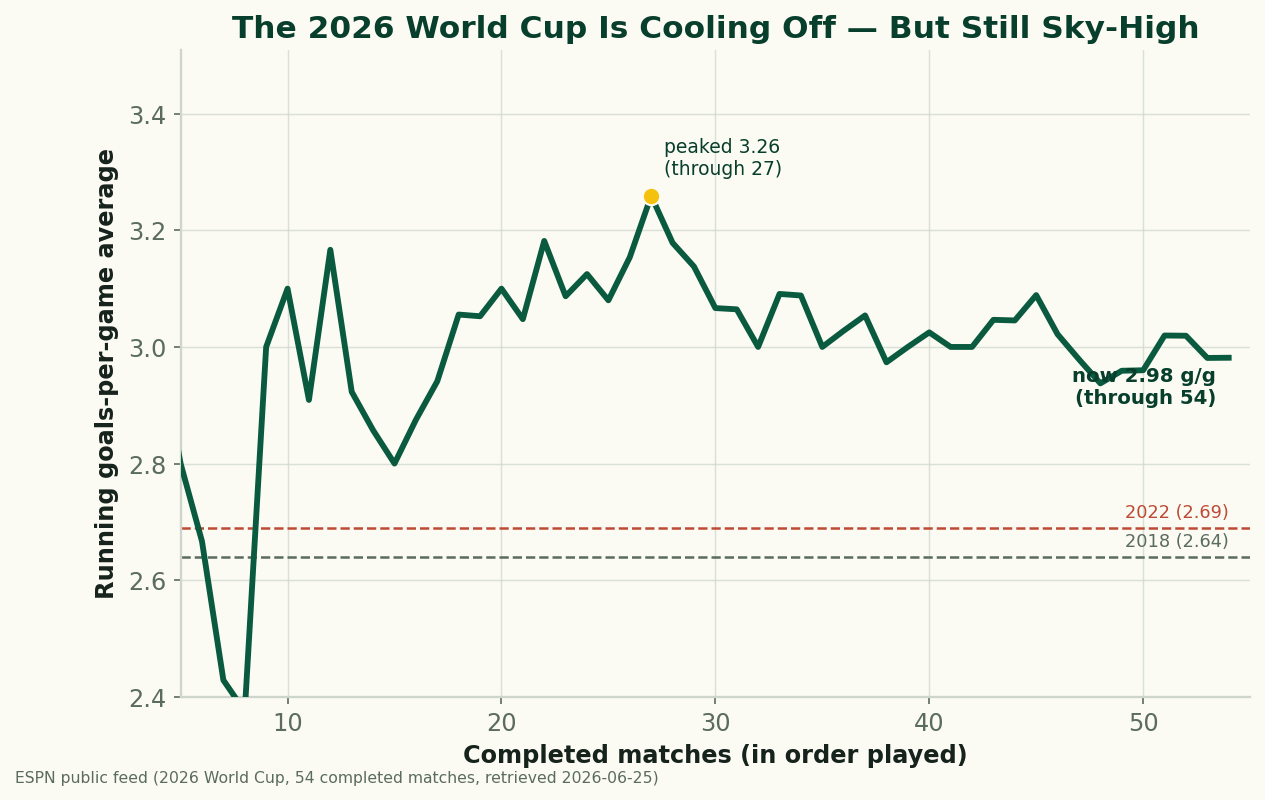
The 2026 World Cup Is Cooling Off — and Still the Highest-Scoring in Generations
Through 54 completed matches, the 2026 World Cup is averaging 2.98 goals a game — down from a blistering 3.26 early on, but still comfortably above 2022 (2.69) and 2018 (2.64), and the highest-scoring World Cup since 1970. A refreshed look at where the goals are going as the group stage closes.
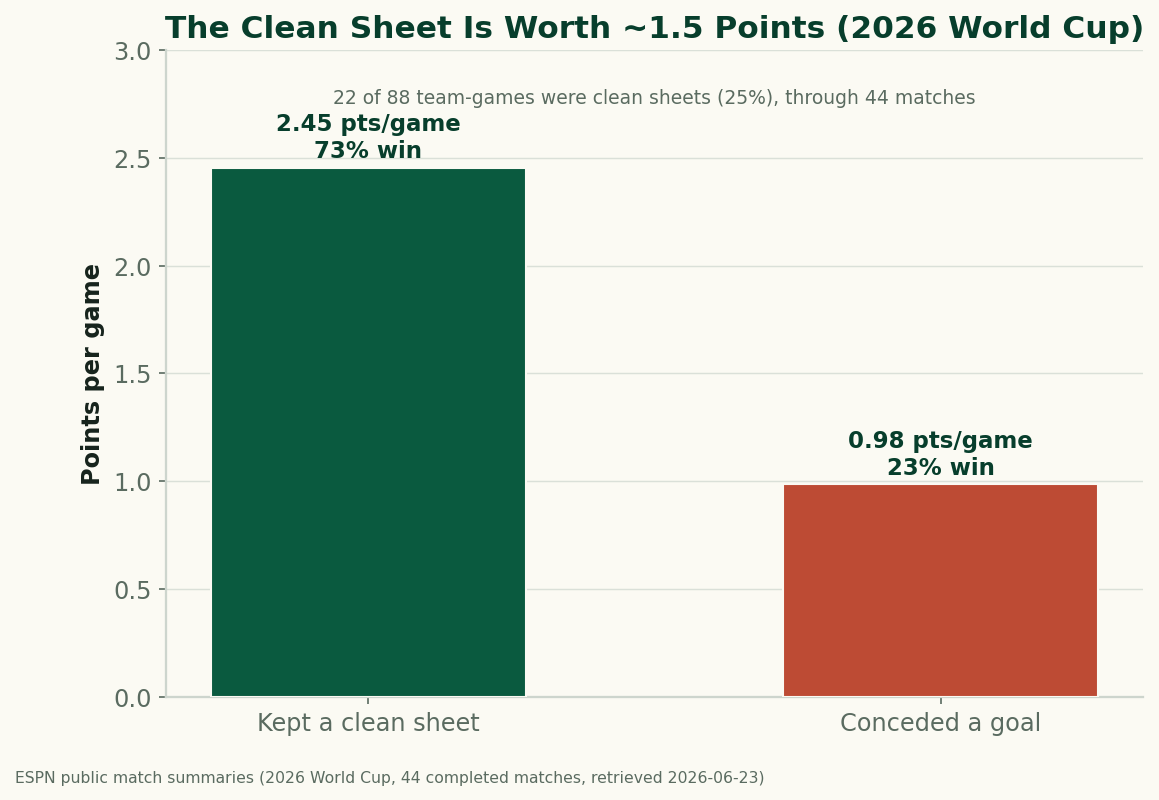
The Clean Sheet Is the Most Valuable Thing at the 2026 World Cup
Through 44 completed matches, a team that keeps a clean sheet at the 2026 World Cup averages 2.45 points and wins 73% of the time; a team that concedes averages under 1. Don't concede and you almost can't lose — the data on what a clean sheet is worth.