We Built a World Cup Prediction Model — Then Backtested It on 2022
Fit on the group stage, simulated through the bracket 20,000 times. What it got right about 2022, what it couldn't, and what it cautiously says about 2026.
Anyone can publish World Cup odds. The honest question is whether the model behind them actually works — so we built one in the open and tested it against a tournament we already know the answer to. We fit a Poisson attack-and-defence rating on only the 2022 group stage, then simulated the real 16-team knockout bracket 20,000 times and read off each side's pre-knockout title odds. The result is both reassuring and humbling: the model's top tier contained the eventual champion and two of the four semifinalists — but no team cleared 15%, and the actual winner, Argentina, was only its fifth pick. That spread is the finding. A good model doesn't tell you who wins; it tells you how wide open the thing really is.
Sourcing & honesty. The 2022 backtest is fit on real group-stage scores from StatsBomb open data; the knockout bracket is the public draw, and every knockout outcome is simulated by the model, never read from the real results. The 2026 section uses the 44 completed matches from ESPN's public feed and is labelled, loudly, as an early-form snapshot — not a forecast. No 2026 result is invented, and no odds are placed on unplayed fixtures.
The exhibit: backtesting on a tournament we already know
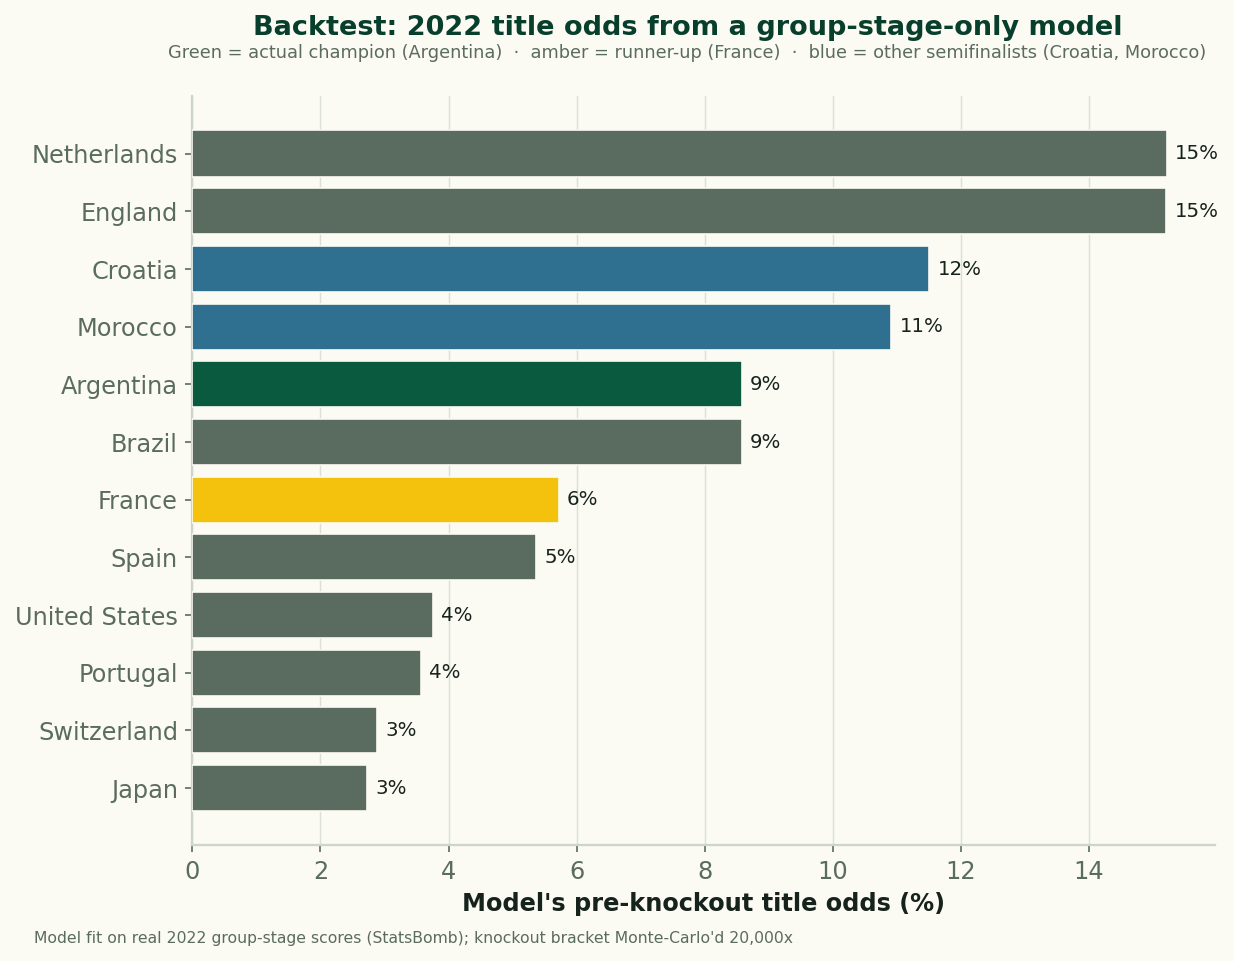
Read it like a scorecard for the method. The eventual champion (Argentina) and both surprise semifinalists (Croatia, Morocco) all sit in the model's top five — two of its top four teams reached the actual semis. That's real signal: the rating wasn't fooled, and it even liked Morocco, the tournament's Cinderella, before their run. At the same time, the model's two favourites, Netherlands and England, went out in the quarters, and the actual winner was its #5 pick at about 9%. Both things are true at once, and both are the point.
Why no team tops 15% — and why that's correct
The single most useful output here is the flatness of the bars. Even the model's favourite wins barely one time in seven. That is not timidity; it's arithmetic. To lift the trophy from the round of 16 a team must win four straight knockout matches against survivors. Even a side that's 65% to win any given game clears four in a row only about 18% of the time. Single elimination compresses everybody toward the middle, which is exactly why World Cups produce shock finalists and why anyone quoting one team at 40% to win it is selling confidence the format can't support. For more on that volatility, see how often the favourite actually wins and don't overfit the knockouts.
How the model works, in five honest steps
- Attack and defence ratings. Each team gets two numbers: how many goals it scores and concedes relative to average, adjusted for the opponents it faced. Beating a strong defence counts for more than beating a weak one.
- Goals as Poisson draws. Expected goals for team A vs B is
league average × attack(A) × defence(B); the actual scoreline is two Poisson random draws. (Why Poisson? See do football goals follow a Poisson?) - Goal cap. We count at most four goals per team per match when fitting, so a 6–2 rout over a weak side doesn't balloon a team's attack rating — a simplified version of the Dixon-Coles correction.
- Shrinkage. With only three group games per team, raw ratings are wild. We pull every rating toward the average by adding a couple of phantom average-team matches. This is the difference between the broken first draft of this model (which gave England 41%) and the sensible one you see above.
- Monte Carlo. Play the whole bracket 20,000 times, ties settled by a strength-weighted coin-flip standing in for extra time and penalties, and count how often each team ends up champion.
What the model could not do
It could not call Argentina specifically, and no honest model could have. Pre-knockout, Argentina, Brazil, France, the Netherlands and Croatia were all in a tight contender band; which one emerged was decided by a handful of moments — a Montiel penalty, a Bono save — that live in the variance, not the ratings. The model's job isn't to remove that variance; it's to size it. A forecast that says “six teams between 6% and 15%, everyone else long” is a correct description of an open tournament, even though it will be “wrong” about the winner 85% of the time.
Applying it to 2026 — with the brakes on
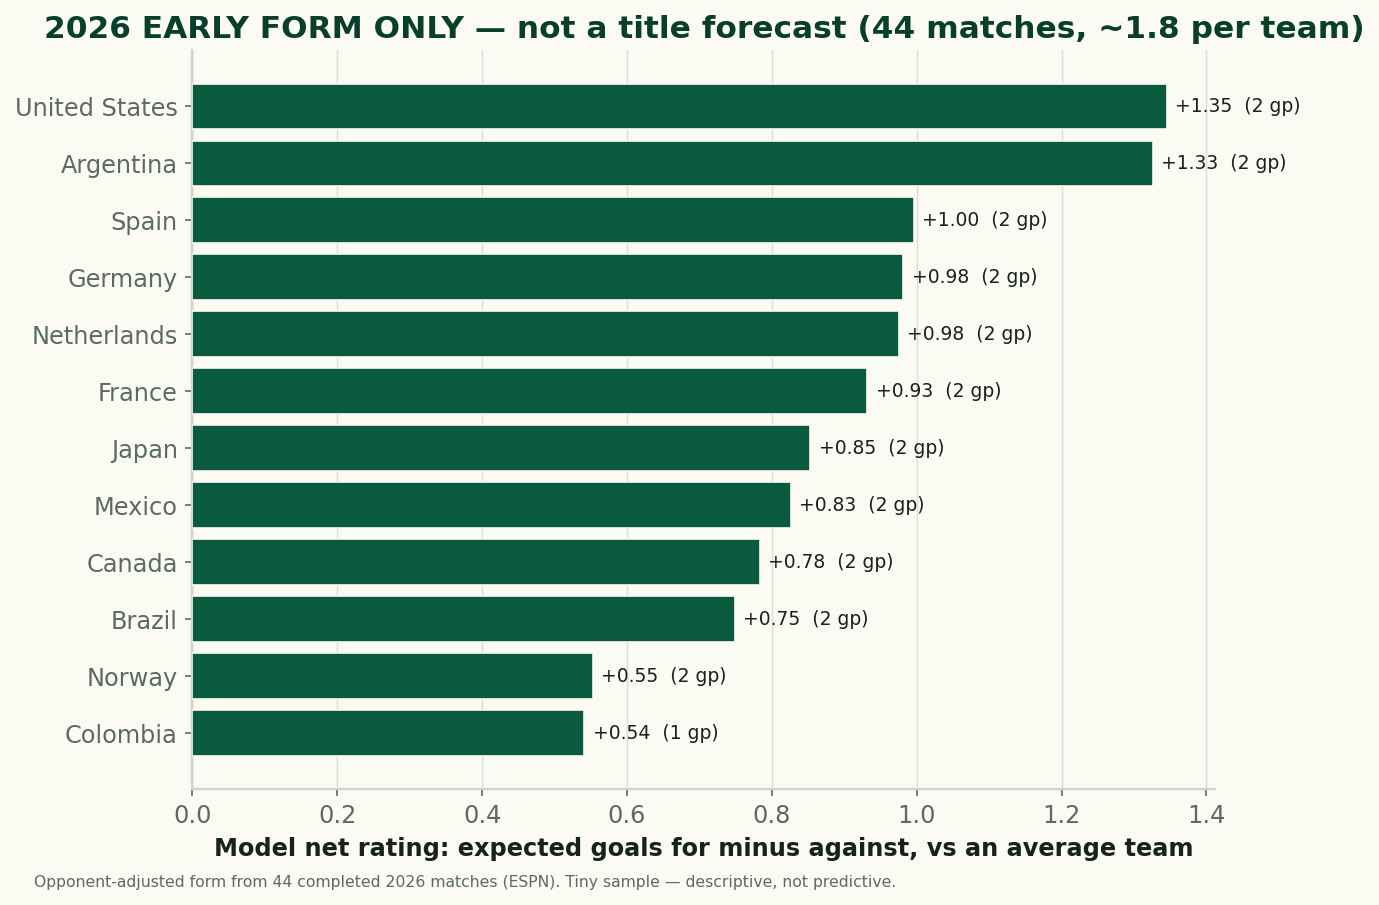
Here is the same machinery pointed at the live tournament, and here is the giant asterisk: this is not a 2026 prediction. With roughly 1.8 games per team and no knockout bracket yet, these are form ratings, not title odds, and the backtest above is precisely why you should treat them gently — even three full group games badly over-rated England in 2022, and 2026 has fewer. Read the chart as “who has looked good so far, opponent-adjusted” — the United States, Argentina, Spain and Germany among them — and nothing more. We will not turn this into a bracket simulation or a title percentage until there are enough real matches to make one that isn't mostly noise.
The honest caveats
- Small samples dominate. Three group games (2022) or fewer (2026) is far too little to pin down a team's true strength; shrinkage helps but cannot manufacture information that isn't there.
- Group strength-of-schedule is uneven. Ratings are opponent-adjusted, but with everyone having played only their own group, the adjustment itself rests on thin data.
- Goals aren't perfectly Poisson or independent. Real scorelines have game-state effects (a leading team sits back) the basic model ignores; the goal cap and shrinkage are patches, not cures.
- The knockout coin-flip is crude. A strength-weighted tiebreak is a stand-in for extra time and penalties, which have their own dynamics (see preparing for penalties).
Try it yourself
Want to feel how sensitive the odds are to your assumptions? Our World Cup 2026 simulator runs this exact pipeline — group round-robins, best-third qualification, and a knockout bracket — from strength ratings you set, thousands of times. Nudge one rating and watch the title odds move. It's the best way to internalise why knockout football refuses to crown a heavy favourite. The full method is written up in how a World Cup simulation works, and the rest of our coverage lives on the World Cup hub.
Reproduce it
The whole model is in charts/chart_wc_prediction.py: fit_ratings() iterates attack/defence to convergence with the goal cap and shrinkage prior; backtest_2022() fits on the group stage and Monte-Carlos the public R16 bracket; form_2026() runs the same fit on completed 2026 matches. 2022 scores come from data_layer/wc2022_matches.json (StatsBomb), 2026 from data_layer/wc2026_results.json (ESPN). No network at build time, nothing hand-entered.
Sources & further reading
- Free textbook: Chapter 20: Predictive Modeling — the theory behind this, at DataField.dev.
- 2022 scores: StatsBomb open data (CC BY 4.0), FIFA World Cup 2022. Data provided by StatsBomb.
- 2026 results: bundled
data_layer/wc2026_results.json— ESPN public feed, 44 completed matches, retrieved 2026-06-23. - Method & tools: Do football goals follow a Poisson? · the Monte-Carlo simulator · don't overfit the knockouts.
- Companion data piece: where World Cup goals are scored from.
More from World Cup 2026
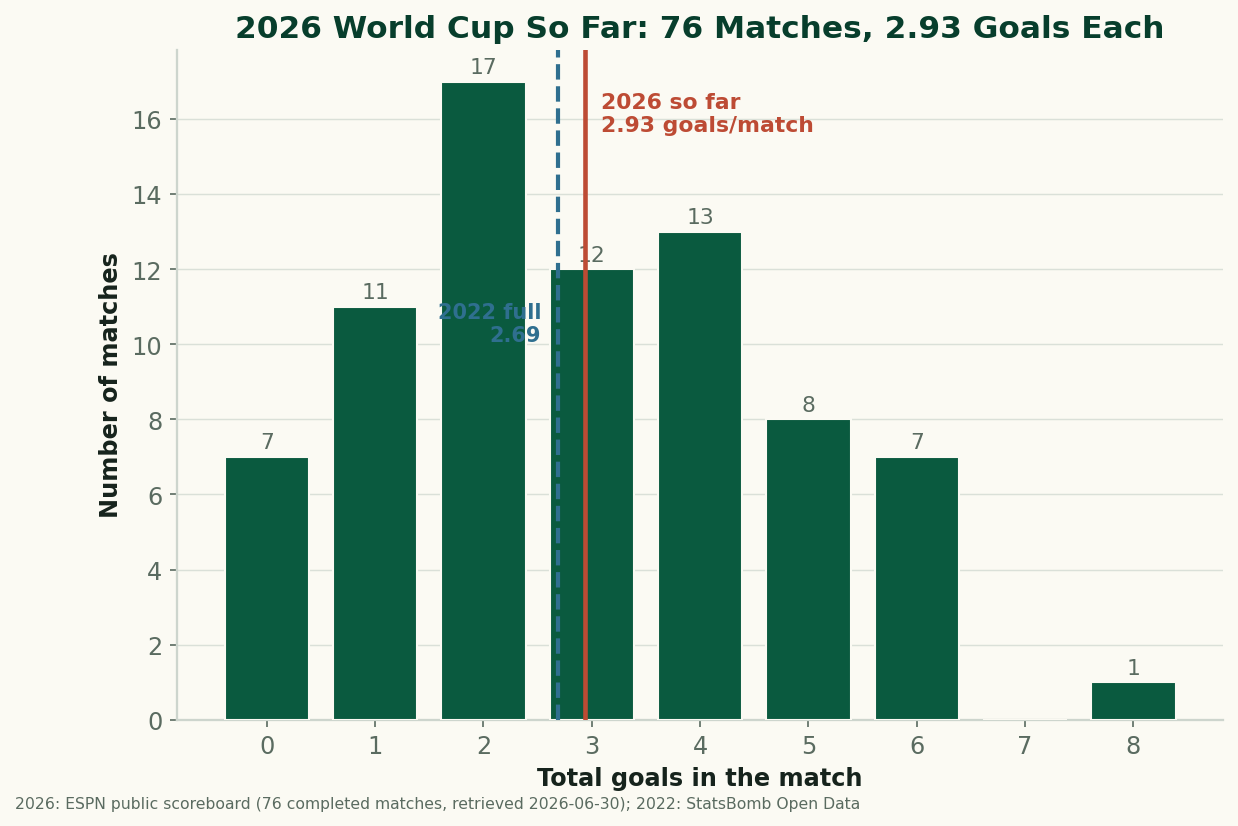
The 2026 World Cup So Far, By the Numbers: Just Under 3 Goals a Game
Through 76 completed matches, the 2026 World Cup is still outscoring 2022 — 2.93 goals a game to 2.69. After an early spike the rate has settled just under 3 a game. The real, sourced numbers on goals, draws, and the blowouts behind them, with honest caveats about a group-stage-only sample. (A living snapshot, refreshed as games are played.)
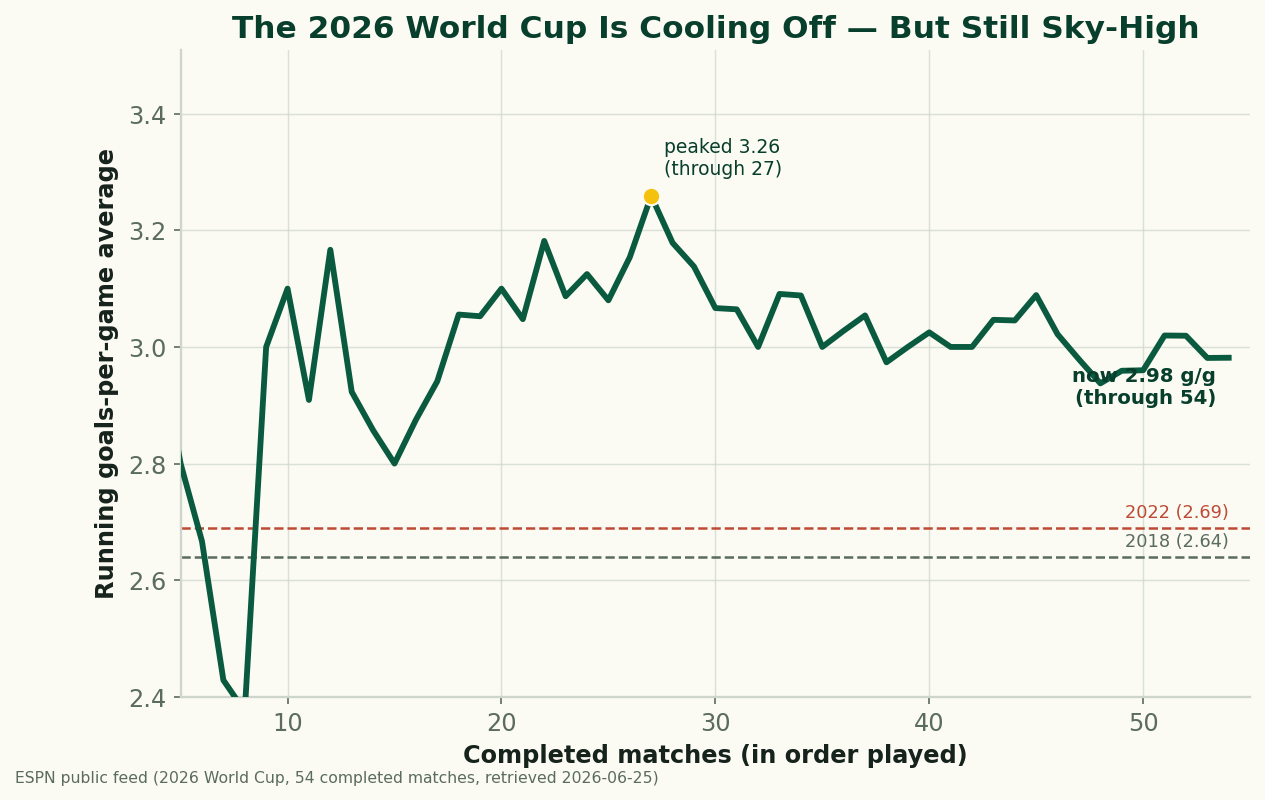
The 2026 World Cup Is Cooling Off — and Still the Highest-Scoring in Generations
Through 54 completed matches, the 2026 World Cup is averaging 2.98 goals a game — down from a blistering 3.26 early on, but still comfortably above 2022 (2.69) and 2018 (2.64), and the highest-scoring World Cup since 1970. A refreshed look at where the goals are going as the group stage closes.
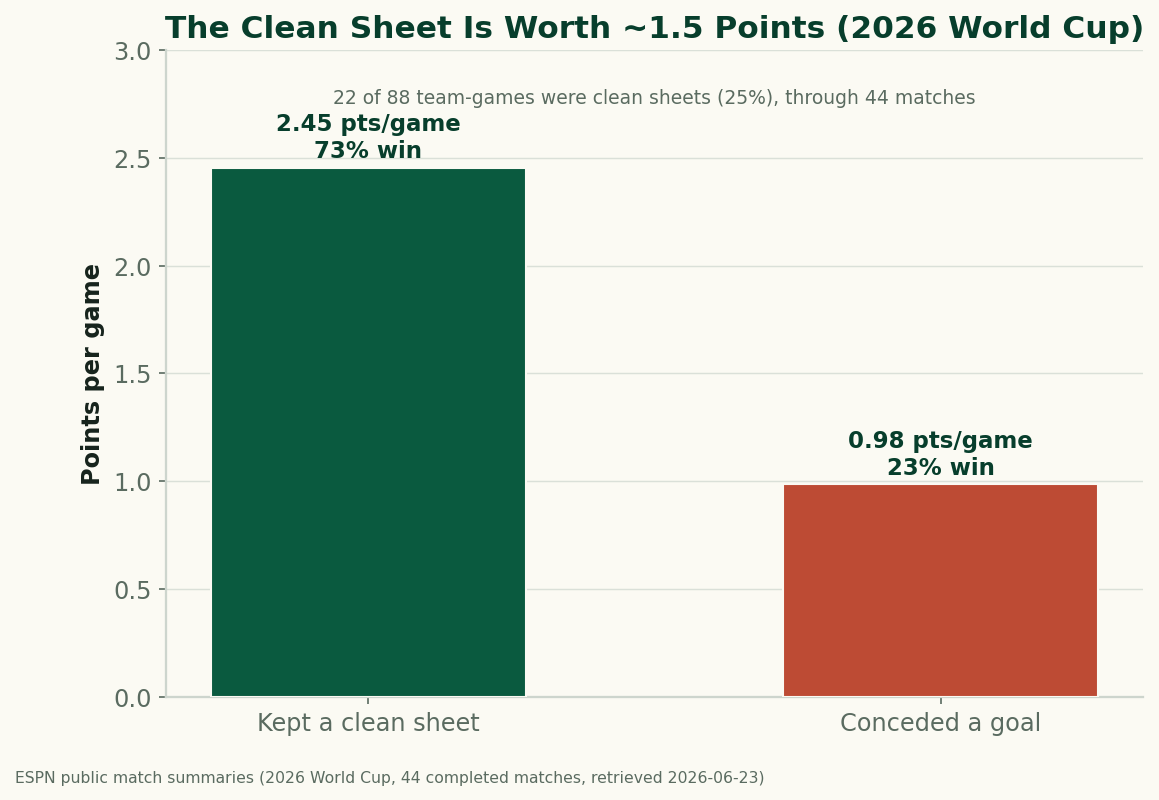
The Clean Sheet Is the Most Valuable Thing at the 2026 World Cup
Through 44 completed matches, a team that keeps a clean sheet at the 2026 World Cup averages 2.45 points and wins 73% of the time; a team that concedes averages under 1. Don't concede and you almost can't lose — the data on what a clean sheet is worth.