A Century of World Cup Scoring, Charted
Ninety years of goals per game, and the rule changes that bent the line.
If you could watch one World Cup match from 1954 and one from 1990 back to back, you would think you were watching two different sports. The first would likely be a goal-soaked, end-to-end affair; the second a tense, low-scoring chess match. The numbers bear that out. World Cup scoring has not been constant — it has a clear, well-documented arc, peaking in the 1950s, bottoming out around 1990, and settling since into a steadier band. The shape of that curve, and the rule changes and tactical shifts that bent it, is one of the cleaner long-run stories in football data.
The shape of the curve
The broad trajectory is not in serious dispute, even if any single decimal place deserves a little caution. World Cup goals per game started high in the early tournaments, climbed to its peak at the 1954 tournament in Switzerland — comfortably above five goals per game, the highest of any edition — then declined steadily across the following decades. The low point came at Italia 1990, with an average down around 2.2 goals per game, the most defensive World Cup on record. Since then the figure has recovered modestly and stabilised, with recent tournaments clustering in the high-2.6 to 2.7 range.
So the century-long story is an inverted curve: a high-scoring youth, a long defensive maturation bottoming out in 1990, and a modern plateau noticeably below the 1950s but comfortably above the 1990 trough. It is one of the few football trends with enough data behind it — every tournament, scored the same way — to state with real confidence.
| Era / edition | Goals per game (approx.) | Character |
|---|---|---|
| 1954 (Switzerland) | ~5.4 | The all-time high — the most open World Cup |
| 1950s–1960s, broadly | ~3.5–4 | High-scoring era, attacking norms |
| 1970s–1980s, broadly | ~2.7–3 | Gradual tightening as organisation improved |
| 1990 (Italy) | ~2.2 | The low point — the most defensive edition on record |
| Recent editions (2018, 2022) | ~2.6–2.7 | Modern plateau, stable across tournaments |
A word on honesty about these numbers: the exact goals-per-game for any one tournament is a matter of record and easy to verify, but the era bands above are deliberately rounded ranges meant to show the trend, not precise claims for every year within them. The endpoints — the 1954 high, the 1990 low, the modern plateau — are the well-established anchors; treat the middle rows as illustrative shape rather than exact figures.
Why the 1950s scored so freely
The early high-scoring era reflects a game that was, tactically, far less organised defensively than today’s. Defensive structures were looser, pressing as a coordinated system did not exist, and the gap in resources and preparation between strong and weak entrants was often vast — producing lopsided scorelines that lifted the average. Fitness levels and tactical discipline were nowhere near modern standards. Goals came more easily because preventing them was simply less of a science.
The long defensive maturation and the 1990 floor
From the 1960s onward, defensive organisation became a discipline in its own right. Italian football’s influence in particular spread the idea that a well-drilled defensive structure could neutralise superior attacking talent. By Italia 1990 this had reached its logical conclusion: a tournament so cautious, so focused on not conceding, that it averaged barely over two goals a game and prompted genuine concern that the spectacle was suffering. The 1990 floor was not an accident — it was the endpoint of three decades of defences getting better faster than attacks could respond.
The rule changes that pushed scoring back up
The recovery from the 1990 low was, in part, engineered. Two changes around that time are the most cited drivers, and the chronology fits the data well.
The back-pass ban (1992). Before 1992, a defender could pass the ball back to the goalkeeper to pick up with his hands — a simple, time-killing way to shut a game down. The rule change outlawing the goalkeeper handling a deliberate back-pass removed that release valve, forcing teams to play out under pressure and keeping the ball in live, contestable situations. It is widely credited with making the game more open.
Three points for a win. The shift from two points to three for a victory — adopted in various competitions through the early-to-mid 1990s — increased the reward for winning relative to drawing, nudging teams toward more positive approaches, particularly in group play where a draw became comparatively less valuable.
Alongside the rules, the broader professionalisation of fitness and sports science raised the tempo and intensity of matches, which over time supported more chances and more goals than the grinding caution of 1990 allowed. The combined effect was to lift scoring off the floor — not back to 1950s levels, but into the stable modern band.
Why it settled rather than soared
The interesting feature of the modern era is its stability. Recent World Cups land within a narrow range of one another, which suggests the game has found a kind of equilibrium between attacking and defensive forces. Attacks have the benefit of higher fitness, sophisticated build-up, and the analytics revolution — expected goals and the optimisation of possession and positional play — while defences have pressing systems, video analysis, and their own data tools. The two arms races roughly cancel, holding the goals-per-game figure steady where neither side runs away from the other.
That steadiness is itself a useful baseline. Because recent tournaments cluster so tightly, a representative modern World Cup rate — somewhere in the high-2.6 range — is a reasonable anchor for what tournament-level scoring looks like now, a point our numbers-led tournament primer leans on. The century-long curve tells you how far the game has travelled from the open contests of the 1950s; the flat modern segment tells you the journey, for the moment, has reached a plateau.
Sources & further reading
- Free textbook: Chapter 5: Introduction to Soccer Metrics — the theory behind this, at DataField.dev.
- FIFA — official tournament records, goal tallies and match counts for every World Cup edition.
- RSSSF — comprehensive historical results from which goals-per-game figures can be reconstructed edition by edition.
- StatsBomb — methodology and data on scoring and chance quality for recent tournaments.
- FBref — match and competition data, including goal totals for recent World Cups.
More from World Cup 2026
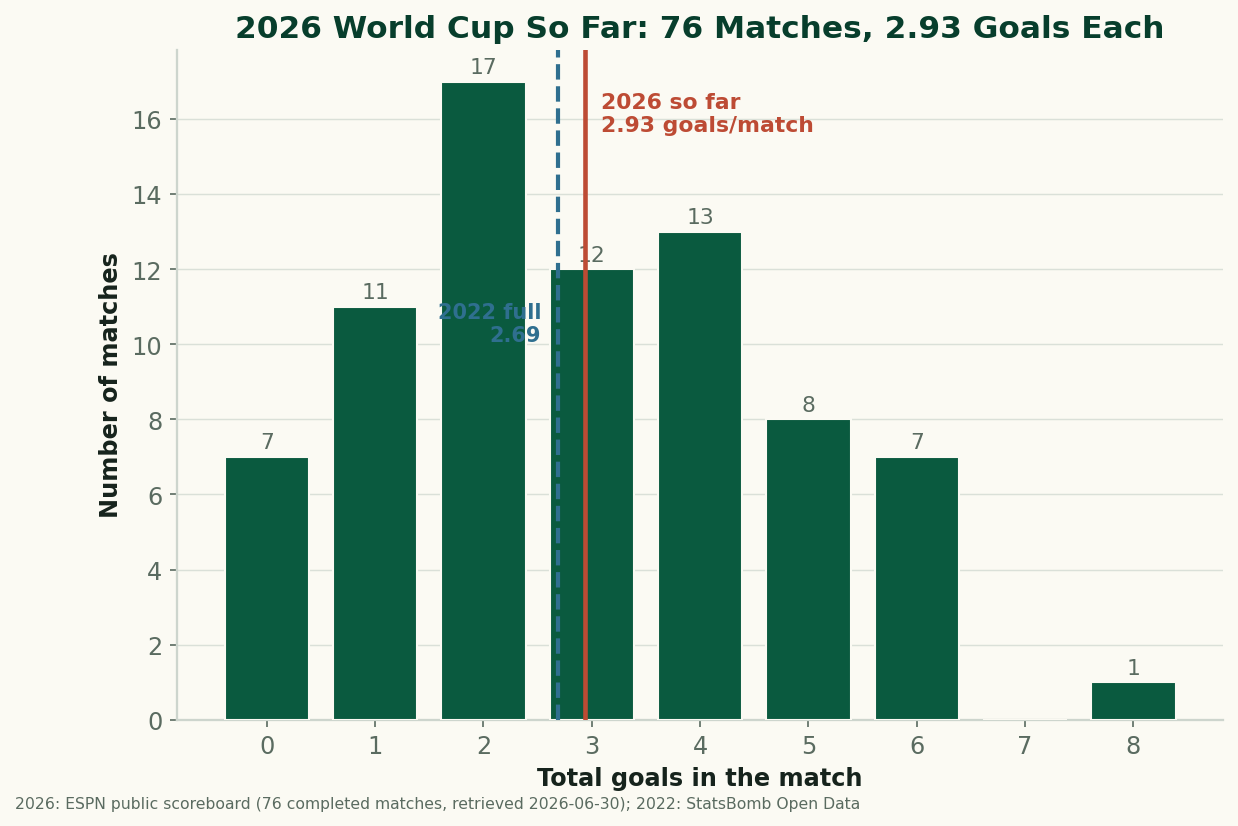
The 2026 World Cup So Far, By the Numbers: Just Under 3 Goals a Game
Through 76 completed matches, the 2026 World Cup is still outscoring 2022 — 2.93 goals a game to 2.69. After an early spike the rate has settled just under 3 a game. The real, sourced numbers on goals, draws, and the blowouts behind them, with honest caveats about a group-stage-only sample. (A living snapshot, refreshed as games are played.)
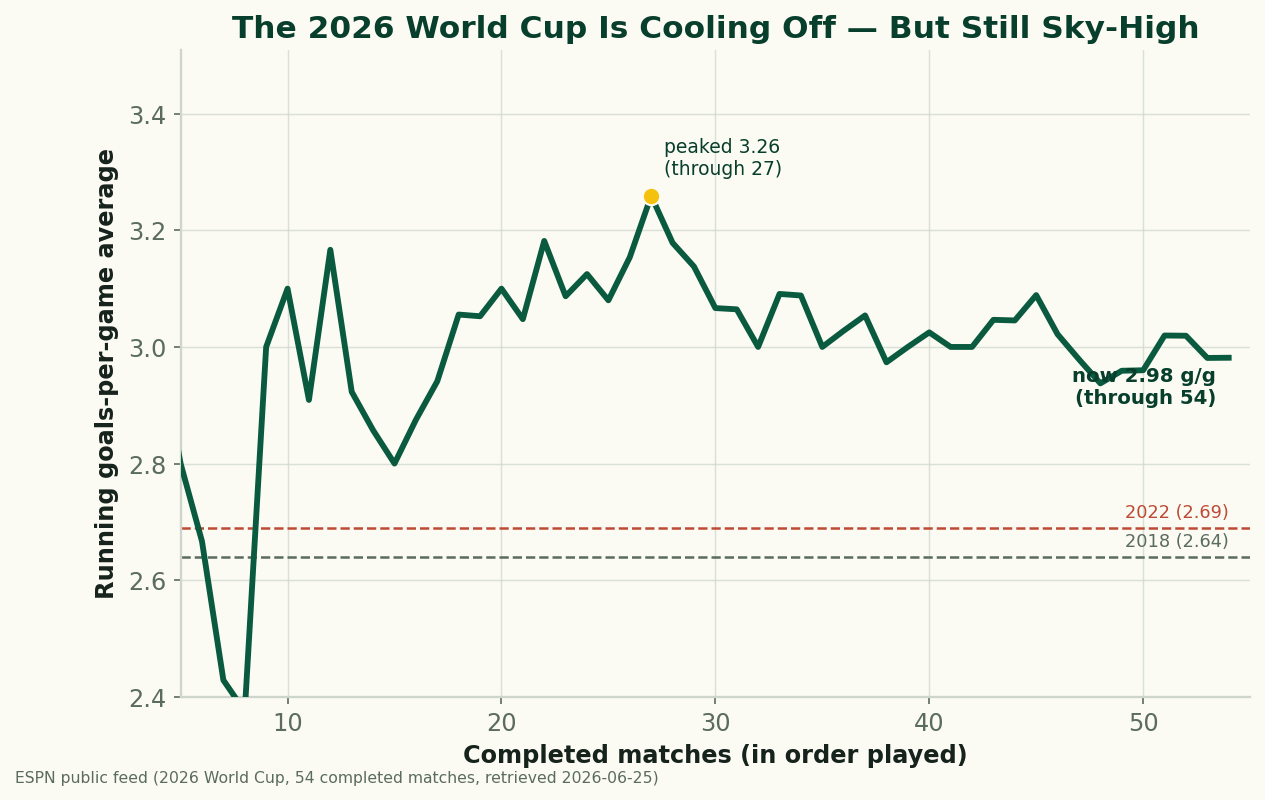
The 2026 World Cup Is Cooling Off — and Still the Highest-Scoring in Generations
Through 54 completed matches, the 2026 World Cup is averaging 2.98 goals a game — down from a blistering 3.26 early on, but still comfortably above 2022 (2.69) and 2018 (2.64), and the highest-scoring World Cup since 1970. A refreshed look at where the goals are going as the group stage closes.
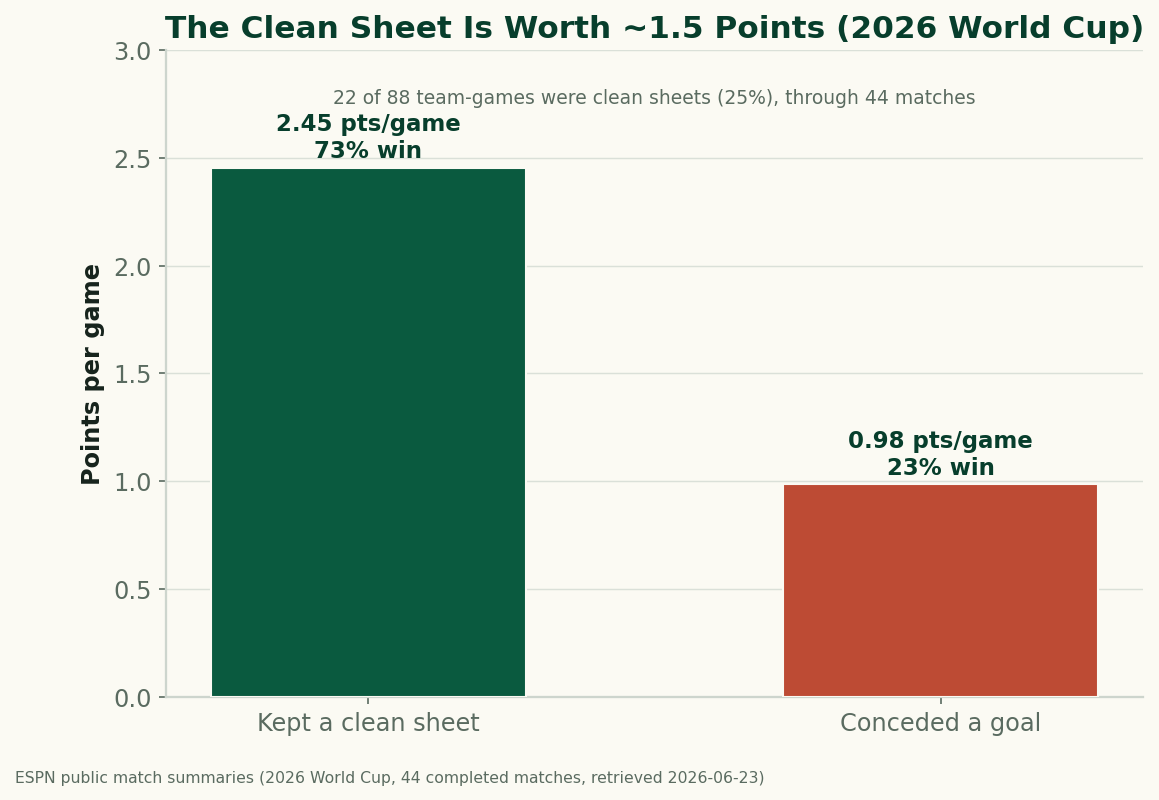
The Clean Sheet Is the Most Valuable Thing at the 2026 World Cup
Through 44 completed matches, a team that keeps a clean sheet at the 2026 World Cup averages 2.45 points and wins 73% of the time; a team that concedes averages under 1. Don't concede and you almost can't lose — the data on what a clean sheet is worth.