How Often Does the Favourite Win the World Cup?
The base rate of the favourite winning — and why it is lower than intuition says.
Ask most people who will win a World Cup and they name one of a familiar handful of countries — and they are usually wrong, not because the favourites are badly chosen but because the favourite, as a category, wins less than half the time. The pre-tournament number-one is the most likely single winner, which is not the same as a likely winner. Understanding that gap — between "the best bet" and "probably going to happen" — is the key to watching a World Cup without being repeatedly, needlessly astonished.
The base rate is lower than intuition
Start with the honest statement of uncertainty: there is no single official ledger of "the pre-tournament favourite" stretching back to 1930, because reliable betting markets and rating systems do not cover the early editions, and reasonable people disagree about who the favourite even was in some years. So the precise hit-rate depends on how you define the favourite. But across every reasonable definition, the conclusion is the same — the clearest pre-tournament favourite has lifted the trophy a minority of the time. The favourite wins more often than any other individual team, and still loses more tournaments than it wins.
This is not a sign that the favourites are mis-rated. It is what you should expect from the structure. If the strongest team in a field of dozens has, say, a one-in-five or one-in-four chance of winning — a perfectly sensible number for the best side in a high-variance knockout — then by definition it fails to win three or four times out of five. A favourite that "only" wins a quarter of the time is not underperforming; it is behaving exactly as a favourite in this format should.
Why a short knockout punishes the best team
The mechanism is the same one that produces improbable underdog runs — viewed from the other end. A league title rewards the best team because thirty-eight matches give quality time to assert itself; variance averages out, and the strongest side usually finishes top. A World Cup gives the best team only about seven matches, several of them single-elimination, and at least one likely to be decided in a coin-flip situation — a one-goal margin, extra time, or a penalty shoot-out.
Football compounds the problem because it is low-scoring. In a sport averaging well under three goals a game, the better team frequently creates the better chances and still loses, because chances created and goals scored diverge most sharply over small samples. Rating systems and power ratings like Elo and SPI can identify the strongest team with reasonable confidence; what they cannot do is overcome the fact that the strongest team must win four or five near-coin-flips in a row to take the title. Each individual edge is real and modest; the requirement to win them all consecutively is what keeps the base rate low.
Brazil’s record, and the limits of pedigree
The obvious objection is Brazil, with five World Cups — more than any other nation. Does that not show the best team usually wins? Not quite. Brazil’s tally is spread across nearly a century and many tournaments; five titles is dominance by the standards of the competition and still a minority of the World Cups Brazil entered as a serious contender. Even the most successful nation in the tournament’s history has, far more often than not, gone home without the trophy in any given edition. Pedigree raises a country’s baseline — it does not lift any single tournament into a likelihood.
And the favourites’ share is diluted by genuine surprise champions. Across the tournament’s history, the trophy has gone to sides that were not the pre-tournament number-one often enough that "an unexpected winner" is a normal outcome rather than a shock to the system. Combine "the favourite usually loses" with "surprise winners are routine," and you have a competition where the eventual champion is frequently a team that was, beforehand, one of several plausible answers rather than the single obvious one.
How models actually frame it
This is exactly why serious pre-tournament models report a probability distribution, not a prediction. A well-built model does not say "Team X will win"; it says the favourite has perhaps a one-in-four or one-in-five chance, the next several contenders a meaningful share each, and the long tail of the field a small but non-zero chance collectively. (Our companion piece on how models rate the field before a tournament walks through how those numbers are built.) Read correctly, such a model is not "wrong" when an outsider wins — it assigned that branch a probability, and improbable branches occur all the time across the whole tree of outcomes.
The same caution applies to ratings during the tournament. A side can create the better chances for six matches and still exit on penalties, and that is not a failure of the rating — it is the variance the rating already implied. The model gives you the odds; the tournament runs the experiment once.
What this means for 2026 — framing, not forecasting
The 2026 World Cup is the first 48-team edition: 12 groups, 104 matches, a longer bracket with a new round of 32. Consistent with this site’s rule, this is a history-and-structure piece and makes no prediction about who is favoured or who will win — the tournament has not been played. But the historical base rate frames how to watch it. The expanded format adds knockout matches, and more knockout matches mean more coin flips, which structurally pushes the favourite’s already-minority win probability down rather than up. A longer single-elimination path is, mathematically, more chances for the best team to lose one it should have won.
So the sober expectation, set entirely by history, is this: whoever the strongest side turns out to be, the most likely outcome is still that some other team lifts the trophy — not because the favourite is overrated, but because a short, low-scoring knockout is built to let that happen. The favourite is the best single bet. The field, collectively, is the favourite to win. Hold both ideas at once and the World Cup stops surprising you and starts making sense.
Sources & further reading
- Free textbook: Chapter 20: Predictive Modeling — the theory behind this, at DataField.dev.
- FIFA — official records of World Cup winners and finalists across the competition’s history.
- RSSSF — historical results and final standings used to assess favourites against outcomes.
- StatsBomb — methodology behind the underlying-quality metrics that inform pre-tournament ratings.
- FBref — match and competition data for international football.
More from World Cup 2026
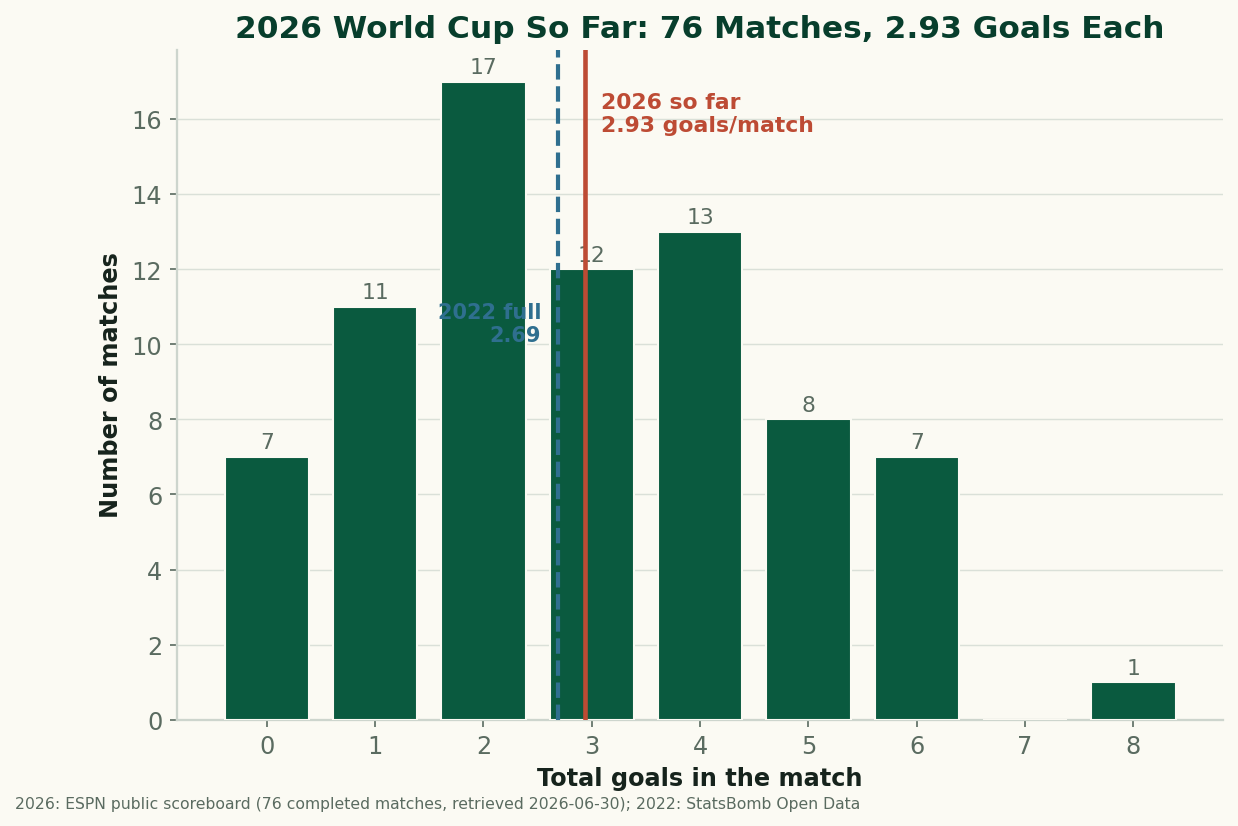
The 2026 World Cup So Far, By the Numbers: Just Under 3 Goals a Game
Through 76 completed matches, the 2026 World Cup is still outscoring 2022 — 2.93 goals a game to 2.69. After an early spike the rate has settled just under 3 a game. The real, sourced numbers on goals, draws, and the blowouts behind them, with honest caveats about a group-stage-only sample. (A living snapshot, refreshed as games are played.)
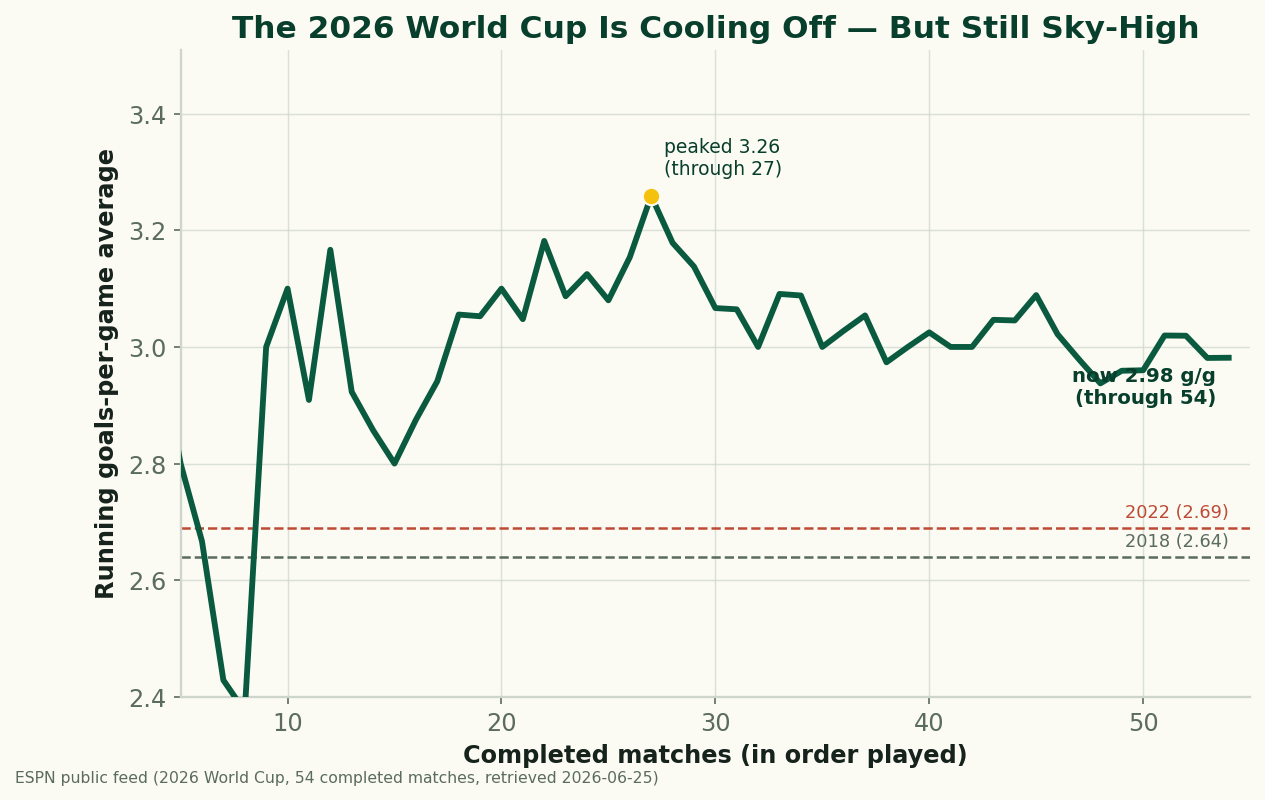
The 2026 World Cup Is Cooling Off — and Still the Highest-Scoring in Generations
Through 54 completed matches, the 2026 World Cup is averaging 2.98 goals a game — down from a blistering 3.26 early on, but still comfortably above 2022 (2.69) and 2018 (2.64), and the highest-scoring World Cup since 1970. A refreshed look at where the goals are going as the group stage closes.
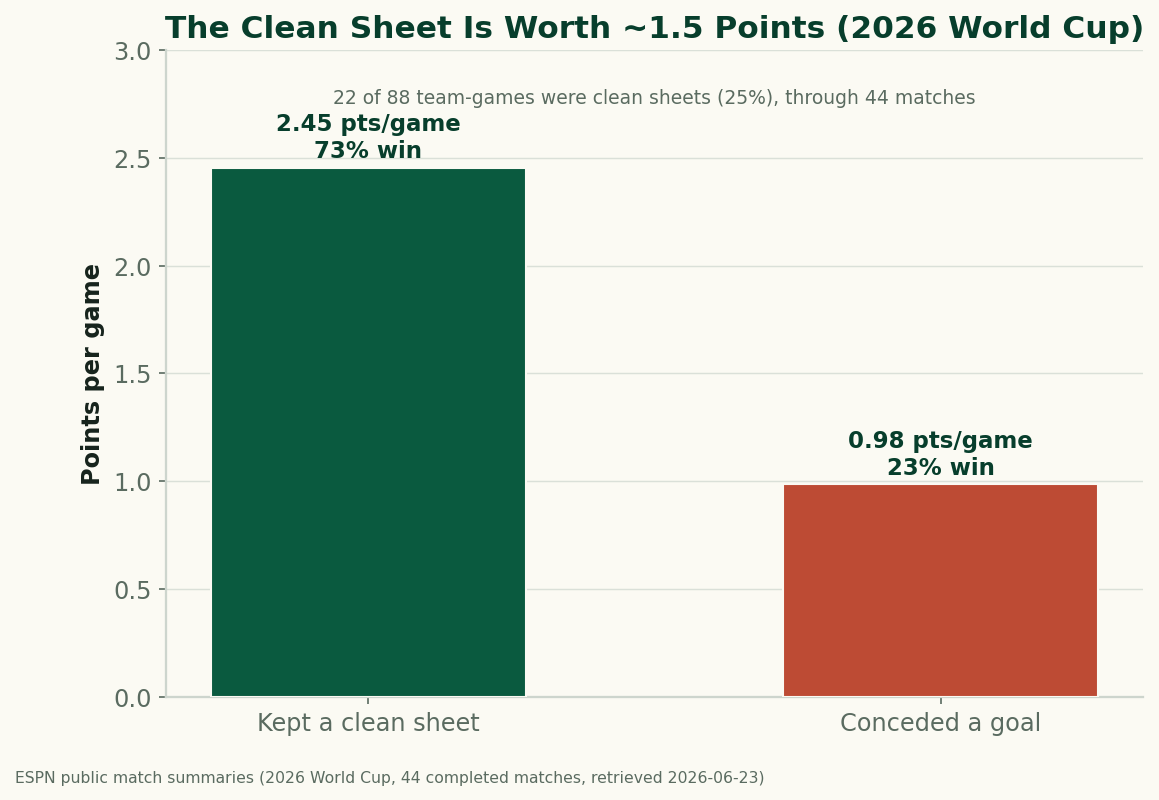
The Clean Sheet Is the Most Valuable Thing at the 2026 World Cup
Through 44 completed matches, a team that keeps a clean sheet at the 2026 World Cup averages 2.45 points and wins 73% of the time; a team that concedes averages under 1. Don't concede and you almost can't lose — the data on what a clean sheet is worth.