A Statistical History of the World Cup Penalty Shootout
Conversion rates, the going-first edge, and the kicks that decided finals.
For its first half-century the World Cup had no shoot-outs. Drawn knockout matches were settled by replays or, occasionally, the toss of a coin. The penalty shoot-out arrived at the tournament in 1982, and it has since become one of its defining instruments — the mechanism that has decided multiple finals and a long list of quarter- and semi-finals. It looks like chaos and chance. It is, in fact, one of the more predictable corners of the sport, and the numbers behind it are unusually clean.
The shoot-out enters the World Cup
The first World Cup shoot-out came at Spain 1982, in the semi-final between West Germany and France — a match still remembered for the drama that preceded the kicks as much as the kicks themselves. From that point on, the shoot-out became the standard tie-breaker for knockout matches level after extra time. Every tournament since has carried the possibility, and most have delivered at least one. The format is fixed and familiar: five kicks each, alternating, sudden death thereafter if still level.
What makes the shoot-out analytically interesting is that it strips the game down to its most repeatable unit. An open-play chance is a one-off; a penalty is nearly the same event every time, which is exactly why the penalty is the most studied shot in football. The shoot-out is that event, stacked — a controlled experiment that happens to decide tournaments.
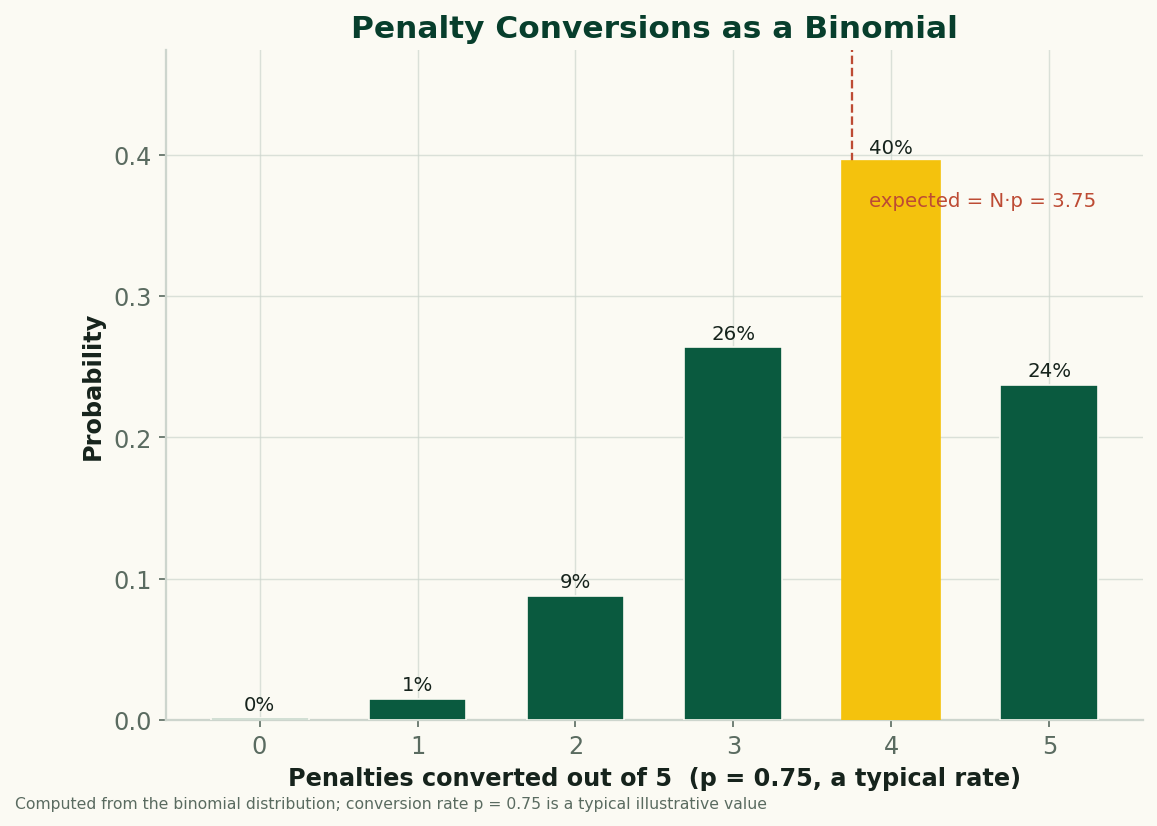
The conversion rate: about three in four
The single most useful number is the conversion rate, and across penalties in normal play it sits historically around three-quarters — roughly 75%, or about one miss in four. Shoot-out kicks specifically tend to convert a little lower than that. The reason is not the geometry, which is identical; it is the pressure. A shoot-out penalty carries a weight that a first-half spot-kick does not, and that psychological load nudges the success rate down, mostly through outright misses (off target, over the bar) rather than saves.
That distinction matters. Goalkeepers save a meaningful share of shoot-out kicks, but a large fraction of the decisive misses are kicks the keeper never had to touch — the ball cleared the bar or slid wide. Under maximum pressure, the failure mode is the taker losing the kick, not the goalkeeper winning the duel. It is one reason post-shot models and goalkeeper-specific metrics treat penalties as a category of their own.
The advantage of going first
One of the more durable findings in the shoot-out literature concerns kicking order. A widely cited body of research argued that the team taking the first penalty in each pair wins more often than the team kicking second — the proposed mechanism being psychological: the side kicking second is repeatedly playing catch-up, taking each kick knowing a miss could end the contest, which is a heavier cognitive burden than kicking with the scoreboard even or ahead.
The honest framing is that this is contested. The original studies reported a sizeable edge for going first; subsequent work with larger and broader samples has found the effect smaller, and some analyses find it weak or inconsistent once you account for everything else. So it is fair to say there is plausibly an advantage to kicking first, that it is the reason captains overwhelmingly choose to go first when they win the toss, and that its true size is genuinely uncertain. What is not in doubt is that teams behave as though it is real — the winner of the coin toss almost always elects to shoot first.
The famous shoot-outs
Three finals anchor the World Cup shoot-out story, and they map neatly onto its statistical themes.
1994, Brazil v Italy. The first — and so far defining — World Cup final decided on penalties. After a goalless match in the Californian heat, the shoot-out ended with Roberto Baggio, the tournament’s outstanding player, sending the decisive kick over the bar. It is the archetypal pressure miss: not a save, but a kick lost to the moment, exactly the failure mode the conversion data predicts under maximum load.
2006, Italy v France. Another final settled from the spot, after a match more remembered for a red card in extra time than for the football. Italy converted their kicks; France did not, with one effort missing the target. A clean, high-conversion shoot-out that nonetheless turned on a single failure — which is how almost every shoot-out resolves, since both teams usually score most of their kicks and the margin is one miss.
2022, Argentina v France. A final widely described as one of the greatest, level after extra time and decided on penalties. It closed a tournament in which the shoot-out again did its job: collapsing an unresolvable match into a sequence of single, repeatable kicks. The broader point holds — when a World Cup knockout match cannot be separated in 120 minutes, the tie-breaker is a contest of nerve over a near-identical shot, and the team that loses the fewest kicks wins.
How to think about a shoot-out
The popular description of the shoot-out as a "lottery" is half right and half misleading. It is high-variance: with conversion clustered around three-quarters and most ties decided by a single miss, the outcome is genuinely close to a coin flip in many matchups, and a better team can and does lose. That is the lottery half, and it is real — the same short-format variance that drives improbable tournament runs and keeps the favourite from winning as often as its quality suggests.
But it is not pure chance. Conversion rates are stable enough to model, the going-first choice is made deliberately for a reason, and the decisive failures cluster predictably under pressure. A shoot-out is a contest with a known structure and a known base rate, resolved on a thin margin. Calling it random gives up too easily on what the numbers actually tell us — which is that you can say a great deal about shoot-outs in general while remaining almost helpless to predict any single one. That tension is the whole appeal.
Sources & further reading
- Free textbook: Chapter 14: Set Piece Analytics — the theory behind this, at DataField.dev.
- FIFA — official records of World Cup knockout matches and shoot-out outcomes since 1982.
- RSSSF — detailed match records including extra-time and shoot-out results across the competition’s history.
- StatsBomb — methodology for penalty and shot modelling, including how spot-kicks are valued.
- FBref — penalty conversion data and match records for international football.
More from World Cup 2026
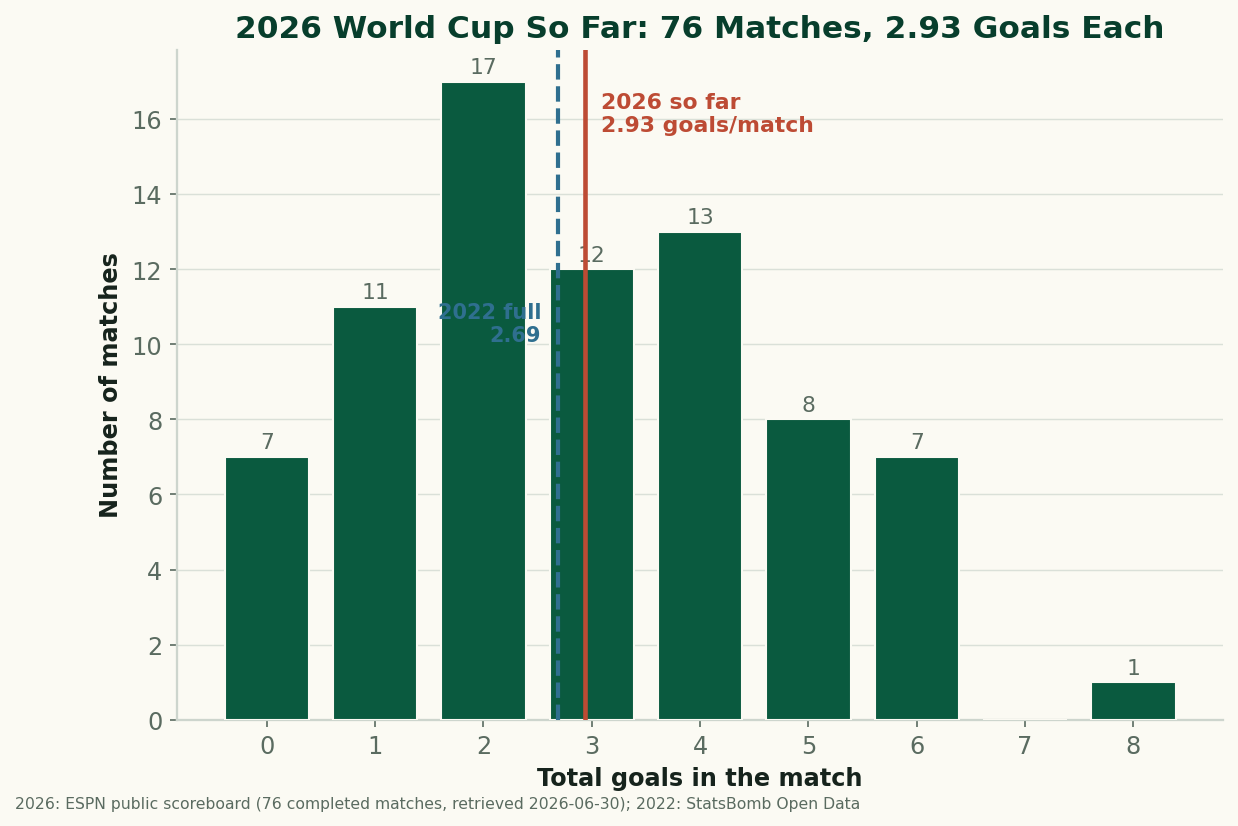
The 2026 World Cup So Far, By the Numbers: Just Under 3 Goals a Game
Through 76 completed matches, the 2026 World Cup is still outscoring 2022 — 2.93 goals a game to 2.69. After an early spike the rate has settled just under 3 a game. The real, sourced numbers on goals, draws, and the blowouts behind them, with honest caveats about a group-stage-only sample. (A living snapshot, refreshed as games are played.)
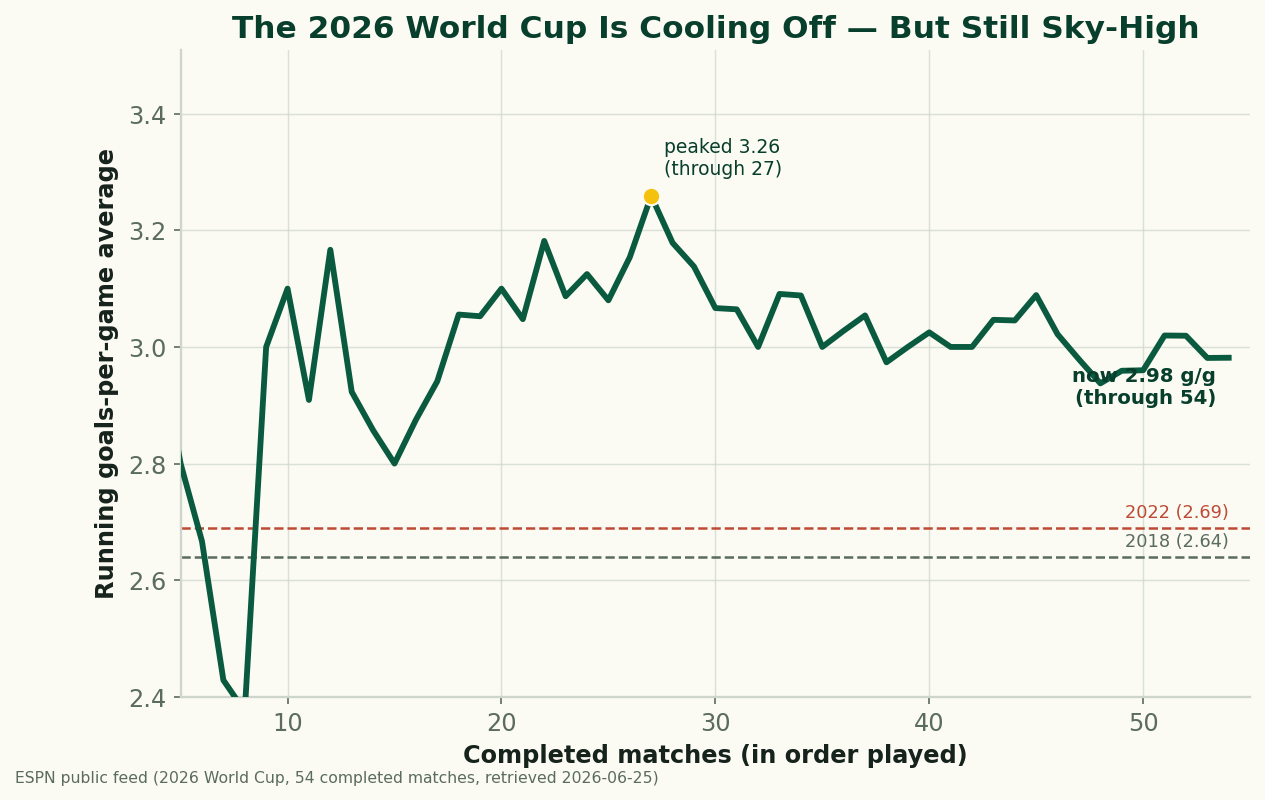
The 2026 World Cup Is Cooling Off — and Still the Highest-Scoring in Generations
Through 54 completed matches, the 2026 World Cup is averaging 2.98 goals a game — down from a blistering 3.26 early on, but still comfortably above 2022 (2.69) and 2018 (2.64), and the highest-scoring World Cup since 1970. A refreshed look at where the goals are going as the group stage closes.
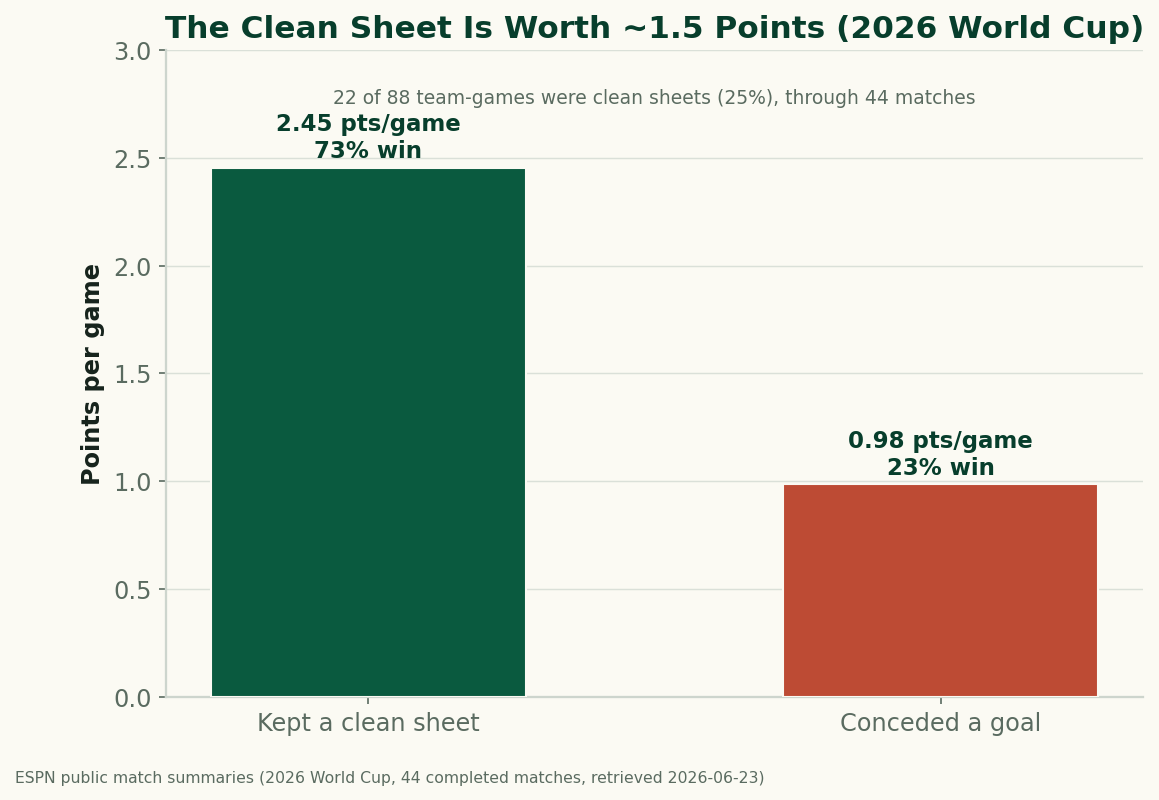
The Clean Sheet Is the Most Valuable Thing at the 2026 World Cup
Through 44 completed matches, a team that keeps a clean sheet at the 2026 World Cup averages 2.45 points and wins 73% of the time; a team that concedes averages under 1. Don't concede and you almost can't lose — the data on what a clean sheet is worth.