Do the Knockouts Really Tighten Up? The 2022 Shot Data Says No
The chance quality of a knockout shot was all but identical to a group-stage one. The famous knockout caution barely shows up — and part of what does is just extra time.
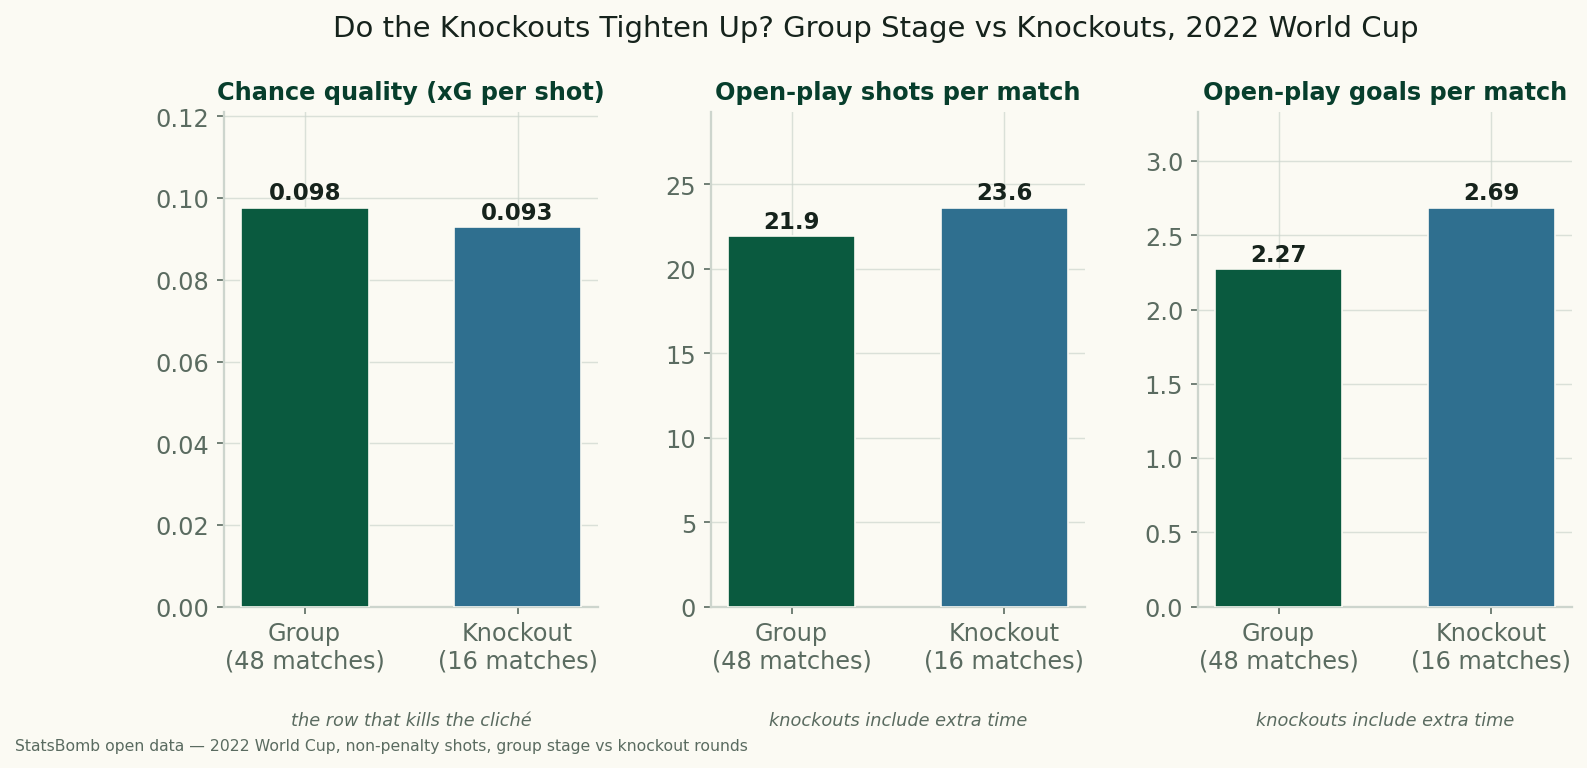
The received wisdom is that tournament football tightens like a fist as the stakes rise: open, breezy group games give way to tense, cagey knockouts where nobody dares commit and everything creeps toward penalties. It is a good story. It is mostly not in the data. Split every open-play shot from the 2022 World Cup into group stage and knockout rounds, and the two phases look almost like the same football. The average knockout shot was worth 0.093 xG against 0.098 in the group stage — a difference you could not see with the naked eye — and knockout matches actually produced more shots and more goals per game, not fewer.
Sourcing. All figures come from StatsBomb's free 2022 World Cup data, all 64 matches: 1,430 open-play shots (penalties excluded), split by the stage each match belonged to. Group stage is the 48 group matches; knockout is the 16 matches from the Round of 16 through the final. Nothing is invented.
The exhibit: group stage vs knockout
| Metric | Group stage | Knockout |
|---|---|---|
| Matches | 48 | 16 |
| Open-play shots per match | 21.9 | 23.6 |
| xG per shot (chance quality) | 0.098 | 0.093 |
| Conversion rate | 10.4% | 11.4% |
| Open-play goals per match | 2.27 | 2.69 |
| Shots from set pieces | 35.3% | 36.2% |
| Shots from counter-attacks | 4.1% | 3.4% |
Real values from StatsBomb Open Data, 2022 World Cup, 1,430 open-play shots. "Set pieces" counts shots from corners and free kicks; "counter-attacks" counts shots StatsBomb tagged as from a counter. Data provided by StatsBomb.
The finding: chance quality barely moves
The row that kills the cliché is "xG per shot." This is the cleanest measure of caution available, because it does not care how long a match lasted or how many shots were taken — it asks a single question: when a team did shoot, how good was the chance? If knockout football were genuinely more careful, you would expect teams to force worse shots against packed defences, and xG per shot would fall. It essentially does not: 0.098 in the group stage, 0.093 in the knockouts. Teams got to the same quality of position when the tournament was on the line as they did in a dead rubber. Whatever tightening happens in a knockout, it is not showing up as worse chances.
The per-match numbers point, if anything, the other way. Knockout games averaged 23.6 shots to the group stage's 21.9, and 2.69 open-play goals to 2.27. On the face of it, the knockouts were the more open phase. The share of shots coming from set pieces (35% versus 36%) and from counters (4% versus 3%) barely budged either. Two-thirds of the tournament's structure — how chances were built, how good they were — was invariant to the stakes.
The honest complication: extra time
Before declaring the knockouts the wilder phase, one confound has to be dealt with squarely, and it is a real one. Group matches always last 90 minutes. Knockout matches can go to 120, and several in 2022 did, including two of the biggest — the Argentina–Netherlands quarter-final and the final itself both went the distance. Those extra thirty minutes add shots and goals to a knockout match's total without the game being any more "open" per minute. So the "more shots and more goals per match" edge is partly an illusion created by measuring per match instead of per 90.
This is exactly why the per-shot column is the one to trust. xG per shot and conversion rate are immune to how long the match ran — they are ratios, not counts. And on those duration-proof measures, the two phases are indistinguishable. The safe, honest reading is not "knockouts are more open" but "knockouts are not more cautious in any way the chance data can detect, and the per-match totals that look higher are inflated by extra time." Either way, the cagey-knockout story loses.
Why the cliché feels true anyway
If the numbers are flat, why does everyone believe it? Three reasons, none of them about chance quality. First, salience: a tense goalless knockout that limps to penalties is unforgettable, and we generalise from the drama rather than the base rate. Second, penalties: knockouts must be settled, so a fair number end in shootouts, which we misremember as "low-scoring caution" when it was often 1–1 after a perfectly normal amount of chances. Third, survivorship in the opponents: by the knockouts the minnows are gone and every match is between good teams, which can make games feel more controlled even as the shot data stays put. The feeling is real; the tactical timidity behind it mostly is not, at least not in 2022.
The honest caveats
- One tournament, and a lopsided split. 48 group matches versus 16 knockout matches. Sixteen games is a modest sample, and one or two high-event ties can tilt the knockout averages. The direction of the per-shot finding is more trustworthy than the exact second decimal.
- Extra time is not fully removed. We flag it and lean on per-shot ratios, but we have not stripped extra-time shots out of the counts; the per-match rows still carry that inflation. Read them with the caveat attached.
- xG per shot is not the only kind of caution. Teams can be cautious in ways this misses — sitting deeper, killing the tempo, taking fewer risks in build-up — without changing the quality of the shots they do get. This measures the shots, not the whole game.
- 2022 is not every World Cup. Other editions, with different favourites and different refereeing, could look different. This is one tournament's answer, not a law.
The takeaway
The next time someone tells you the knockouts are where the handbrake goes on, ask them to point to it in the numbers, because in 2022 it is not there. Chance quality per shot was all but identical from group stage to final, the share of chances built from set pieces and counters held steady, and the per-match totals that look higher for the knockouts are propped up by extra time. Knockout tension is real, and it lives in the consequences — one mistake ends your tournament — not in a measurable collapse of attacking ambition. If you want to understand why knockout results still feel so random despite all this, it is not caution; it is that a handful of chances decide each game, and over a single match that handful is a coin toss, which is the whole case against overfitting the knockouts.
Reproduce it
From data_layer/wc2022_shots.json, drop penalties, then label each shot Group (stage is "Group Stage") or Knockout (everything else). Per phase, count the distinct match_ids, count shots and goals, sum the xg, and tally the play_pattern shares. Divide by matches for per-match rates; xG-per-shot and conversion are ratios that ignore match length. No network at build time, nothing hand-entered.
Sources & further reading
- Shot, stage & xG data: StatsBomb open data (free public dataset; attribution required), FIFA World Cup 2022, all 64 matches, bundled as
data_layer/wc2022_shots.json. Data provided by StatsBomb. - Companion: a handful of chances decide a World Cup and don't overfit the knockouts.
- Background: expected goals explained · simulating the knockout rounds.
Inside the 2022 World Cup: all 64 results
This section was first published on 16 June 2026 as a separate article.
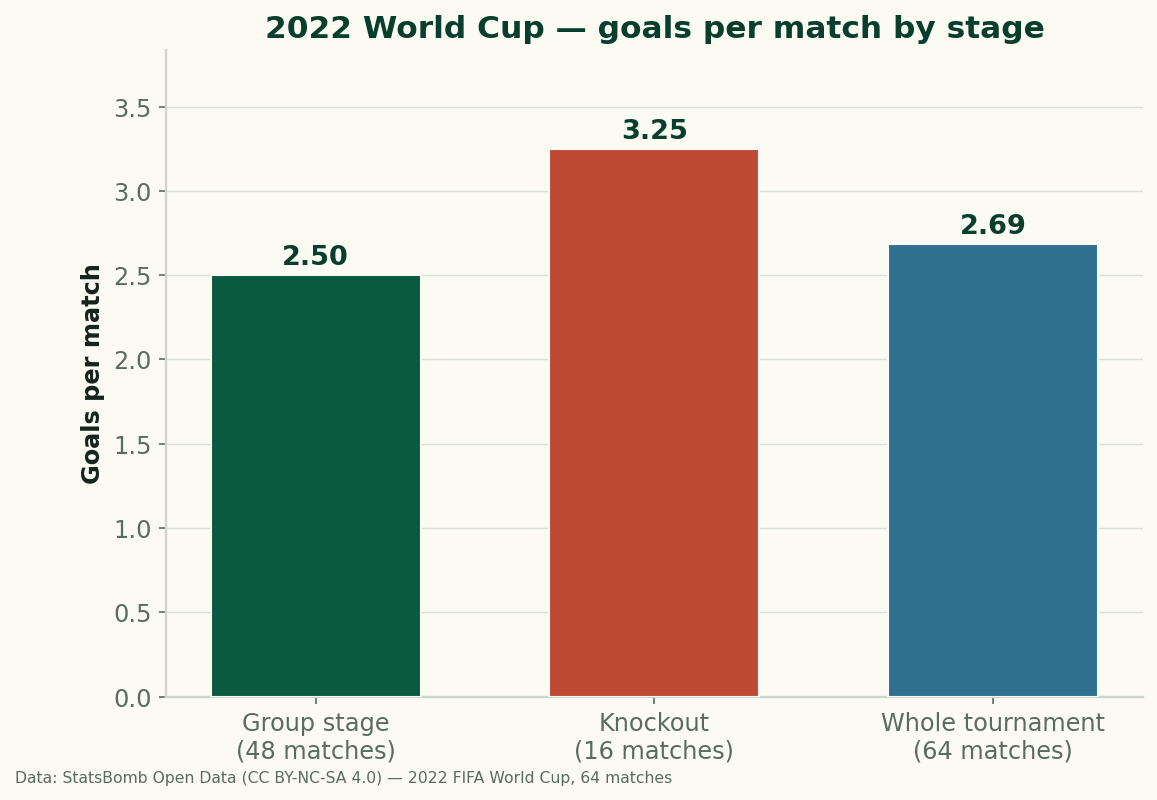
Everyone "knows" the knockout rounds of a World Cup are where the goals dry up: tight, cagey, terrified affairs where two evenly matched sides cancel each other out and the whole thing limps to penalties. So here is a fact that should give that intuition pause. We took the real results of all 64 matches of the 2022 World Cup — every scoreline, every stage, straight from StatsBomb Open Data — and the knockout rounds averaged 3.25 goals per match against the group stage's 2.50. The "tight knockouts" averaged thirty percent more scoring than the group games. That number is real, and it is also a trap, and untangling why is a small clinic in reading a tournament from its box scores rather than its highlight reel.
The finding: 172 goals, and where they fell
Start with the totals, because everything else hangs off them. Across the 64 matches the 2022 World Cup produced 172 goals — an average of 2.69 goals per match over the whole tournament. That is computed the only honest way: add every home_score and away_score in the results file, divide by 64. No estimation, no model. Now split it by stage:
| Stage | Matches | Goals | Goals / match |
|---|---|---|---|
| Group stage | 48 | 120 | 2.50 |
| Knockout rounds | 16 | 52 | 3.25 |
| Whole tournament | 64 | 172 | 2.69 |
Real values from StatsBomb Open Data, 2022 FIFA World Cup, all 64 matches. "Knockout" = Round of 16, quarter-finals, semi-finals, third-place play-off, and the final.
The gap is the headline, and it runs the opposite way to the folk wisdom. The forty-eight group games — three per group, the part of the tournament with the most to play for and the least to lose — were the cagey ones, at exactly 2.5 goals each. The sixteen win-or-go-home games averaged a goal and a half more between them, three-and-a-quarter apiece. Before we explain why that comparison is rigged (it is, and the rigging is the interesting part), look at the shape of the whole thing.
Exhibit: goals per match, by stage
And here is how those 172 goals distributed across the 64 individual matches — how many were goalless, how many were three-goal games, how many were blowouts:
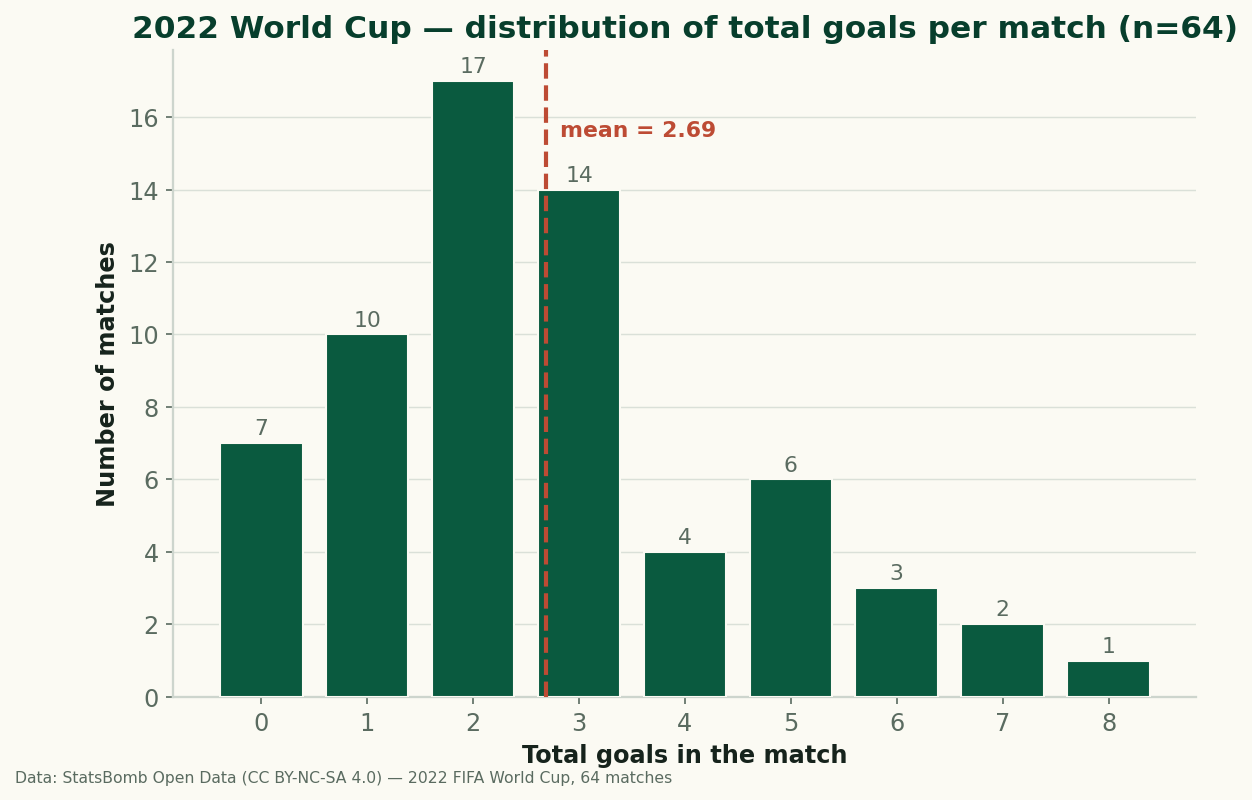
The distribution is the classic lumpy-Poisson shape you get from low-scoring sport: a fat cluster at one, two and three goals (41 of the 64 matches), a thin but real right tail of goal-fests, and a stubborn pile of seven goalless draws on the left. The single most common outcome was a two-goal match — seventeen of them, better than one game in four. The mean of 2.69 sits, as it usually does for goals data, to the right of the mode, dragged there by the high-scoring tail rather than describing any typical match. That is the first lesson of tournament data: the average is a real number that no single match looks like.
The scorelines: 2–0 was the World Cup's favourite result
Collapse every match onto its scoreline (treating 2–1 and 1–2 as the same result, since which team is "home" is meaningless at a neutral-venue World Cup) and a clear hierarchy appears:
| Scoreline | Matches |
|---|---|
| 2–0 | 12 |
| 2–1 | 11 |
| 1–0 | 10 |
| 0–0 | 7 |
| 1–1 | 5 |
| 3–0 / 3–1 / 3–2 / 4–1 | 3 each |
Top of the scoreline distribution; the long tail includes 3–3 (twice), 4–2, 6–1, 6–2 and a 7–0, one apiece.
2–0, 2–1 and 1–0 together — the three tightest "one team edges it" scorelines — account for 33 of the 64 matches, more than half the tournament. This is what a World Cup actually looks like underneath the drama: a slim margin, decided late, far more often than not. Which leads to the two numbers we find most telling of all:
- 24 of the 64 matches (37.5%) were decided by a single goal. Add the 15 draws and you have 39 matches — nearly two in three — that finished within one goal either way.
- Five matches finished level after extra time and went to a penalty shootout. All five sit in the knockout rounds, where a draw is not allowed to stand: Japan 1–1 Croatia and Morocco 0–0 Spain in the Round of 16; Netherlands 2–2 Argentina and Croatia 1–1 Brazil in the quarters; and the final itself, Argentina 3–3 France. (The results file records the score at which each went to spot-kicks; the shootout result is a separate fact of record, not a scoreline in the data.)
At the extremes: the highest-scoring match of the tournament was England 6–2 Iran, the opening-day eight-goal avalanche; the most lopsided was Spain's 7–0 dismantling of Costa Rica. At the other end, seven matches finished 0–0 — six of them in the group stage, plus Morocco's goalless Round-of-16 win over Spain that they took on penalties. One match in nine produced no goals at all.
A worked example: where the 2.50 comes from
"Goals per match" sounds like it might hide some weighting or adjustment. It does not — it is the most literal statistic in this whole piece, and it is worth doing two rows of it by hand so you can see there is nothing up our sleeve. Take two real group-stage results from the file:
- England 6–2 Iran — that match contributed 6 + 2 = 8 goals.
- Argentina 1–2 Saudi Arabia — the great upset — contributed 1 + 2 = 3 goals.
Those two group matches alone hold 11 goals across 2 games. Do that for all 48 group matches and the goals sum to 120; divide by 48 and you get 120 ÷ 48 = 2.50 goals per group match, exactly. Repeat over the 16 knockout games (52 goals) and you get 52 ÷ 16 = 3.25. Stack the two together — 172 goals over 64 matches — and 172 ÷ 64 = 2.6875, which rounds to the 2.69 on the chart. Every figure in this article is that same one-line arithmetic on the raw scores. There is no model here, and that is deliberate: results are one of the very few things in football you can count without estimating anything.
Honest limitations: why the knockout number lies
Now the part that stopping at "knockouts scored more" would leave out. The 3.25 figure is true but unfair, for reasons that all push the same way:
- Extra time inflates the knockout total. Five of the sixteen knockout matches played an extra thirty minutes — the four that went to shootouts plus any that were level at 90 and won in extra time. A group game is 90 minutes; a third of these knockouts were 120. More minutes means more goals almost mechanically. On a strict per-90 basis the knockout scoring rate is meaningfully lower than 3.25, and the gap with the group stage narrows or closes. The results file gives us final scores, not the minute each goal was struck, so we cannot compute the per-90 rate from this dataset alone — and we will not invent it. That ceiling is the honest boundary of a results-only analysis.
- Survivorship skews who is left. By the knockouts the worst sides have gone home. A 7–0 mismatch is a group-stage phenomenon; a Portugal 6–1 against a tiring Switzerland is the rare knockout blowout. The teams are stronger and closer, which should suppress scoring — and yet the raw average rose, which only sharpens how much of the rise is the extra-time artefact.
- Caution genuinely does suppress open-play goals in knockouts — the folk wisdom is not wrong about behaviour, only about the final tally. A tied knockout doesn't end; it goes to extra time and then a lottery, so sides protect a point that protects nothing. The cageyness is real in the run of play; it is simply outweighed in the box score by the extra half-hour those cagey games then play.
- It is one tournament. Sixty-four matches is a single draw from a noisy process. Qatar 2022 had its own host conditions, its own draw, its own once-a-cycle storylines. None of these rates is a law of World Cups; they are the measured facts of this one. A neutral-venue tournament also strips out the home advantage that shapes club-season data, so don't port these averages onto a league.
Reproducibility: the code behind every number
Everything above comes from one file, data_layer/wc2022_matches.json, and a dozen lines of Python. The full chart script is in the repo at charts/chart_wc2022_tournament.py; the core that produces the by-stage rates is this:
import json, collections

ms = json.load(open("data_layer/wc2022_matches.json", encoding="utf-8"))
KNOCKOUT = {"Round of 16", "Quarter-finals", "Semi-finals",
            "3rd Place Final", "Final"}

def rate(rows):
    g = sum(m["home_score"] + m["away_score"] for m in rows)
    return g, len(rows), g / len(rows)

grp = [m for m in ms if m["competition_stage"]["name"] not in KNOCKOUT]
ko  = [m for m in ms if m["competition_stage"]["name"]     in KNOCKOUT]

print("group   ", rate(grp))   # (120, 48, 2.5)
print("knockout", rate(ko))    # (52, 16, 3.25)
print("all     ", rate(ms))    # (172, 64, 2.6875)

dist = collections.Counter(m["home_score"] + m["away_score"] for m in ms)
print(dict(sorted(dist.items())))  # {0:7, 1:10, 2:17, 3:14, ...}
The two figures above are drawn by that same script, so the chart and the table cannot drift apart. Re-run python charts/build_charts.py and you get identical PNGs and identical numbers, because they all read the one results file.
Synthesis: what a box-score tells you, and what it cannot
This is the coarsest possible view of a World Cup — nothing but the scores — and it still pays. It tells you the tournament was tight (a third of all matches decided by one goal), that the group stage was the careful part and the knockouts the chaotic-looking one, and that the average match no one actually saw — 2.69 goals — is the mean of a lumpy spread that ran from seven goalless draws to a single eight-goal opener. What a results file cannot tell you is which team deserved any of it. For that you have to go down a level, from scores to shots. The 2022 final is the cleanest case: it finished 3–3 and went to penalties, yet the shot-level xG breakdown of that final shows Argentina out-created France almost three to one in open play. The scoreline said "even"; the shot map said "rout." If you want the grammar of that next layer down, the guide to reading a World Cup shot map walks through dots sized by danger and goals ringed — the picture a box score can never draw.
And if a results table makes you want to run the counterfactual — what should these scorelines have been, or what happens if you replay the bracket — that is exactly what the tools here are for. Feed two teams' goal expectations into the xG outcome calculator and it turns them into win/draw/loss probabilities; or push a whole field through the World Cup simulator and watch how often the favourite actually survives seven one-off matches like these. Sixty-four games taught us the World Cup is a coin-flip dressed as a coronation. The simulator is how you make it flip the coins.
Sources & data
- StatsBomb Open Data — the match-results file for the 2022 FIFA World Cup (all 64 matches) (free public dataset; attribution required). Every count, rate and scoreline here is computed directly from
home_score,away_scoreandcompetition_stagein that file. - Result of record: Argentina won the 2022 World Cup, beating France in the final — 3–3 after extra time, 4–2 on penalties, 18 December 2022 at Lusail Stadium.
- Anatomy of the 2022 World Cup final — the shot-by-shot xG story behind that 3–3, the level below the scoreline.
More from Data Deep-Dives
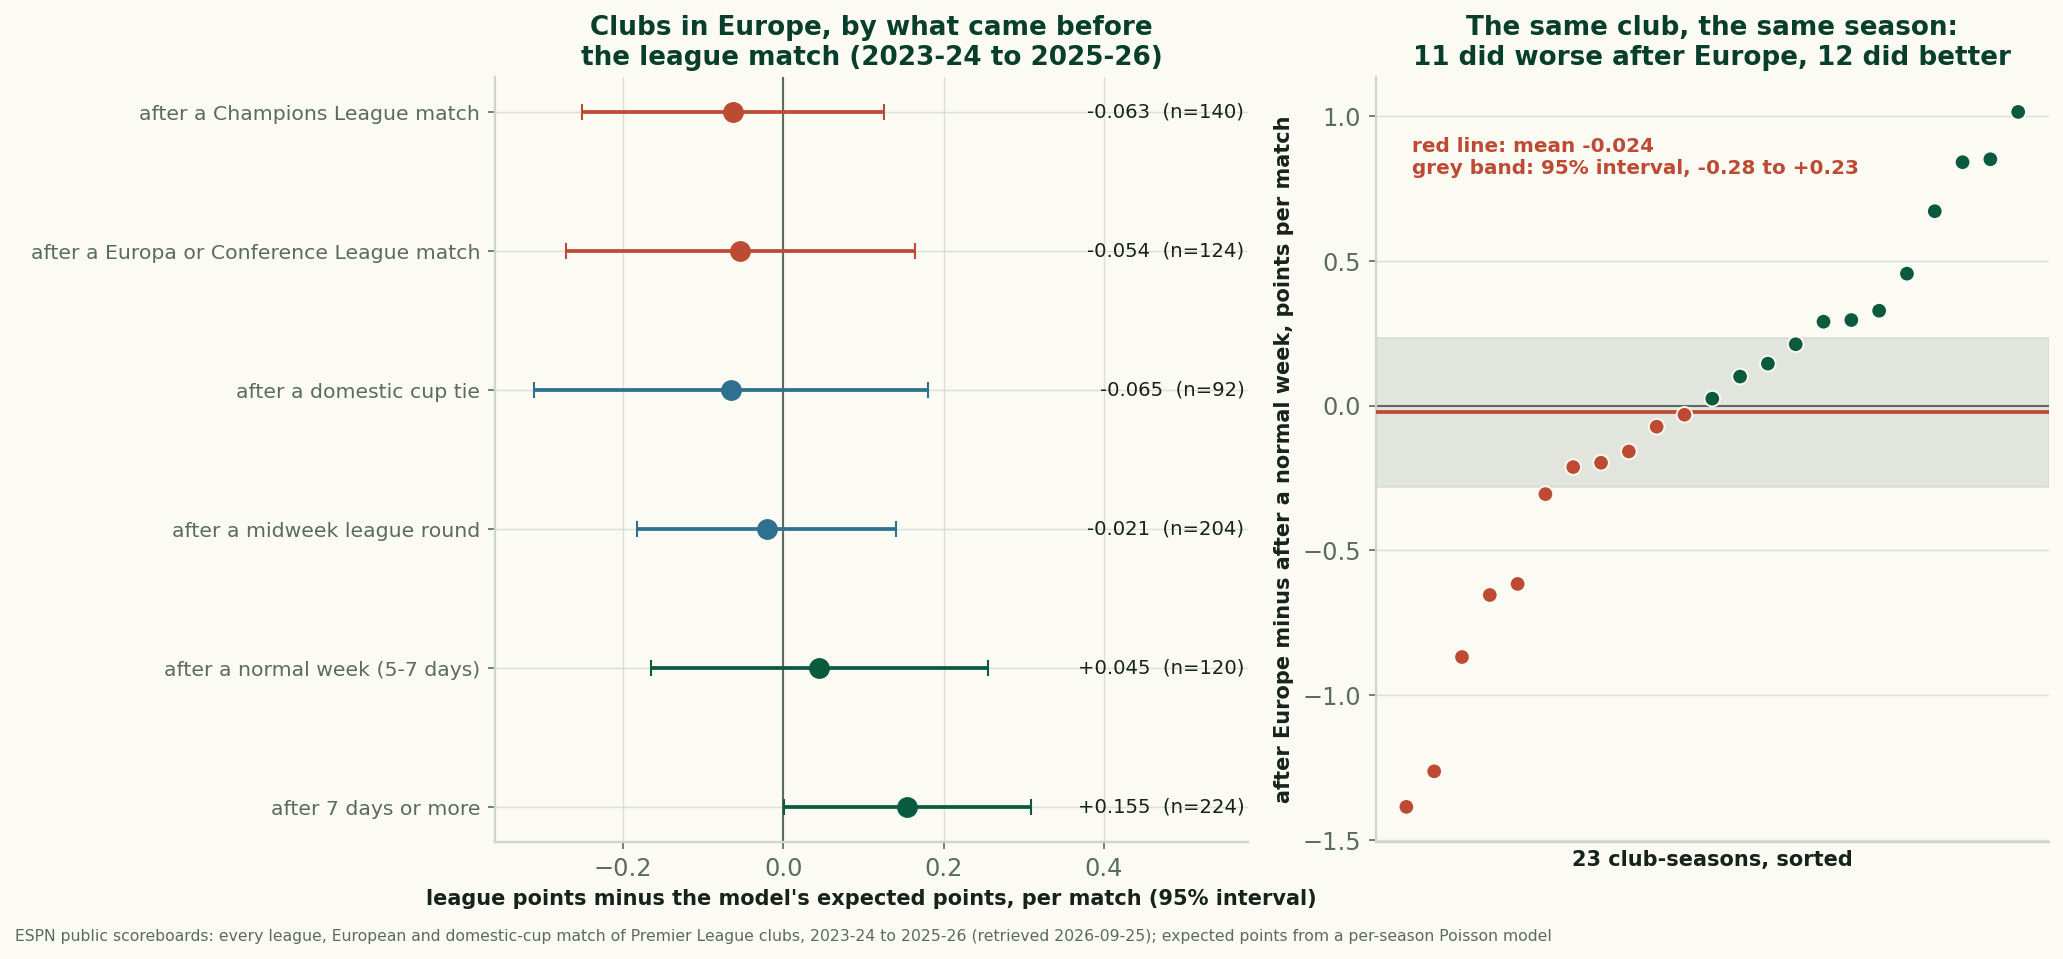
Does Europe Cost English Clubs at the Weekend? Three Seasons Can't Find It
After a European night, English clubs took 1.56 league points a match against 1.62 expected. Within the same club and season the gap is -0.024: not measurable.
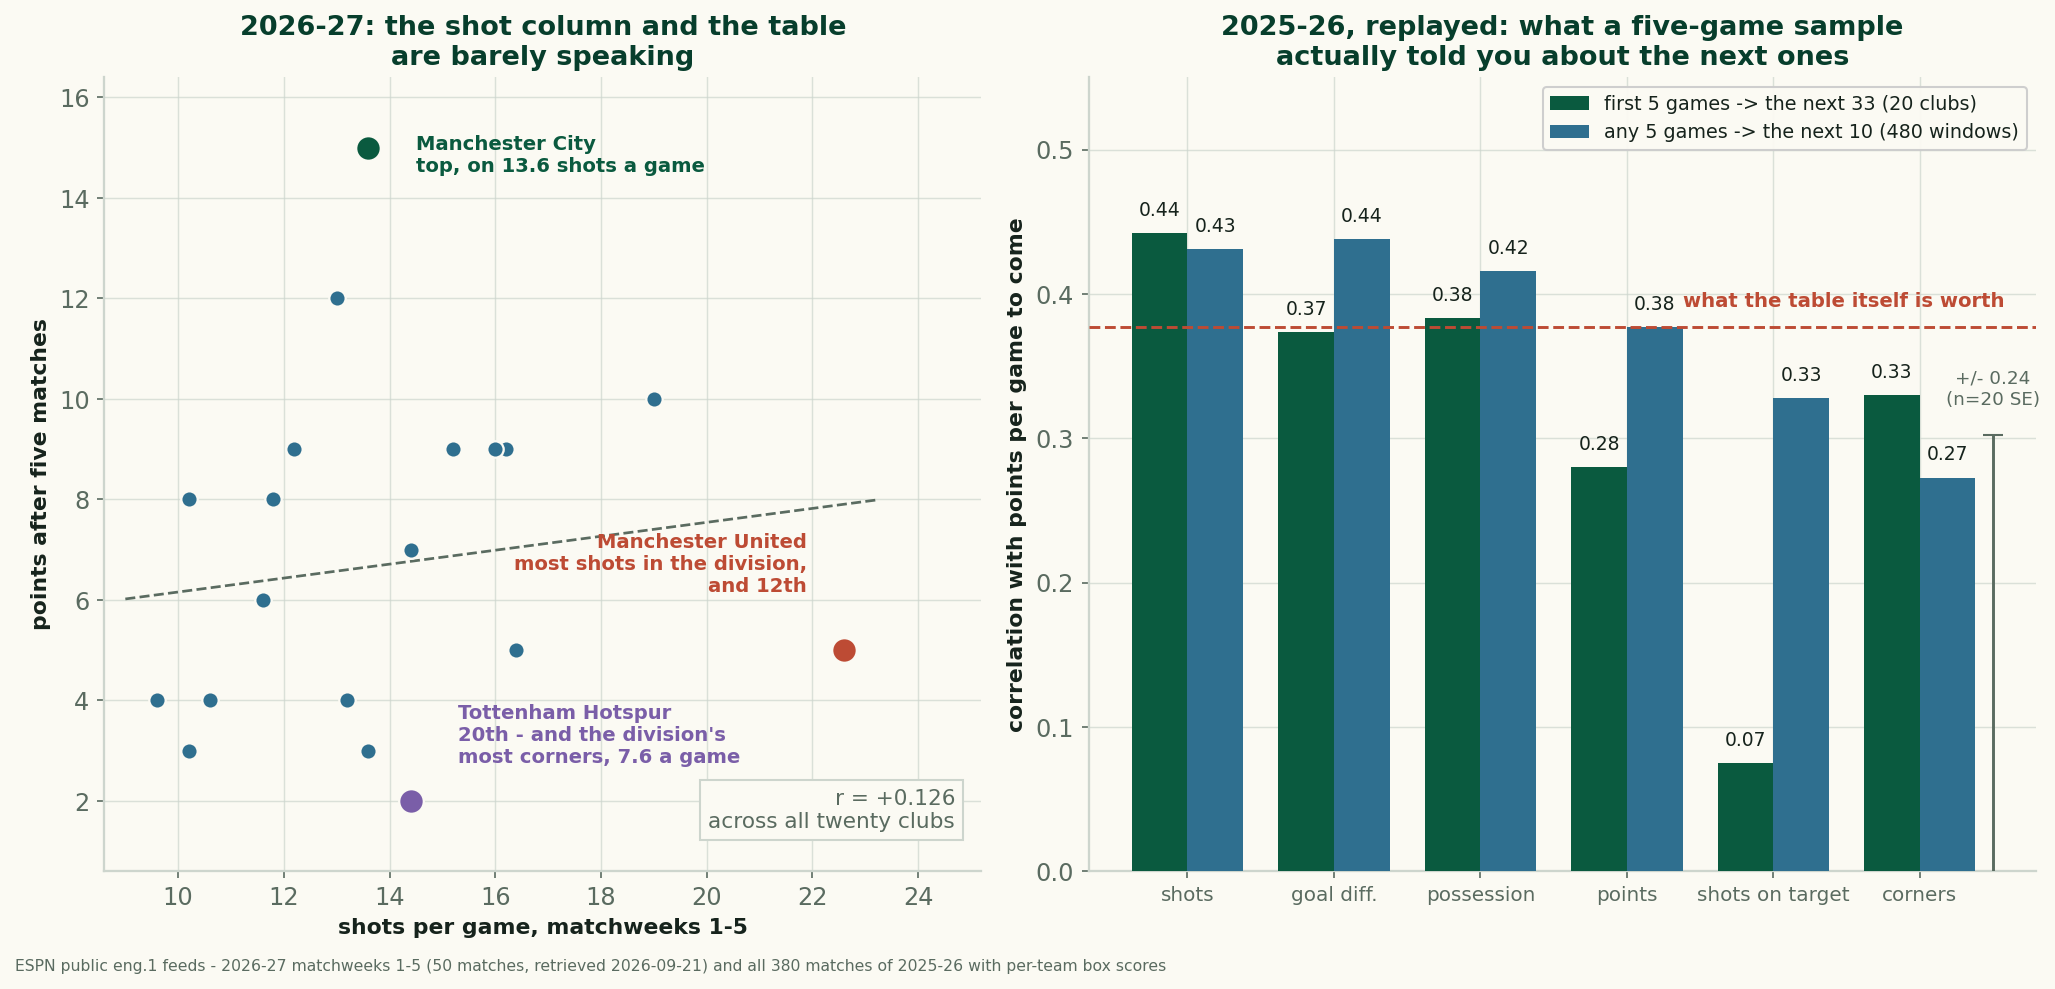
Manchester United Lead the League in Shots and Sit Twelfth
United take 22.6 shots a game and have 5 points. Across 2025-26, a club's five-game shot count predicted its next results better than its points did.
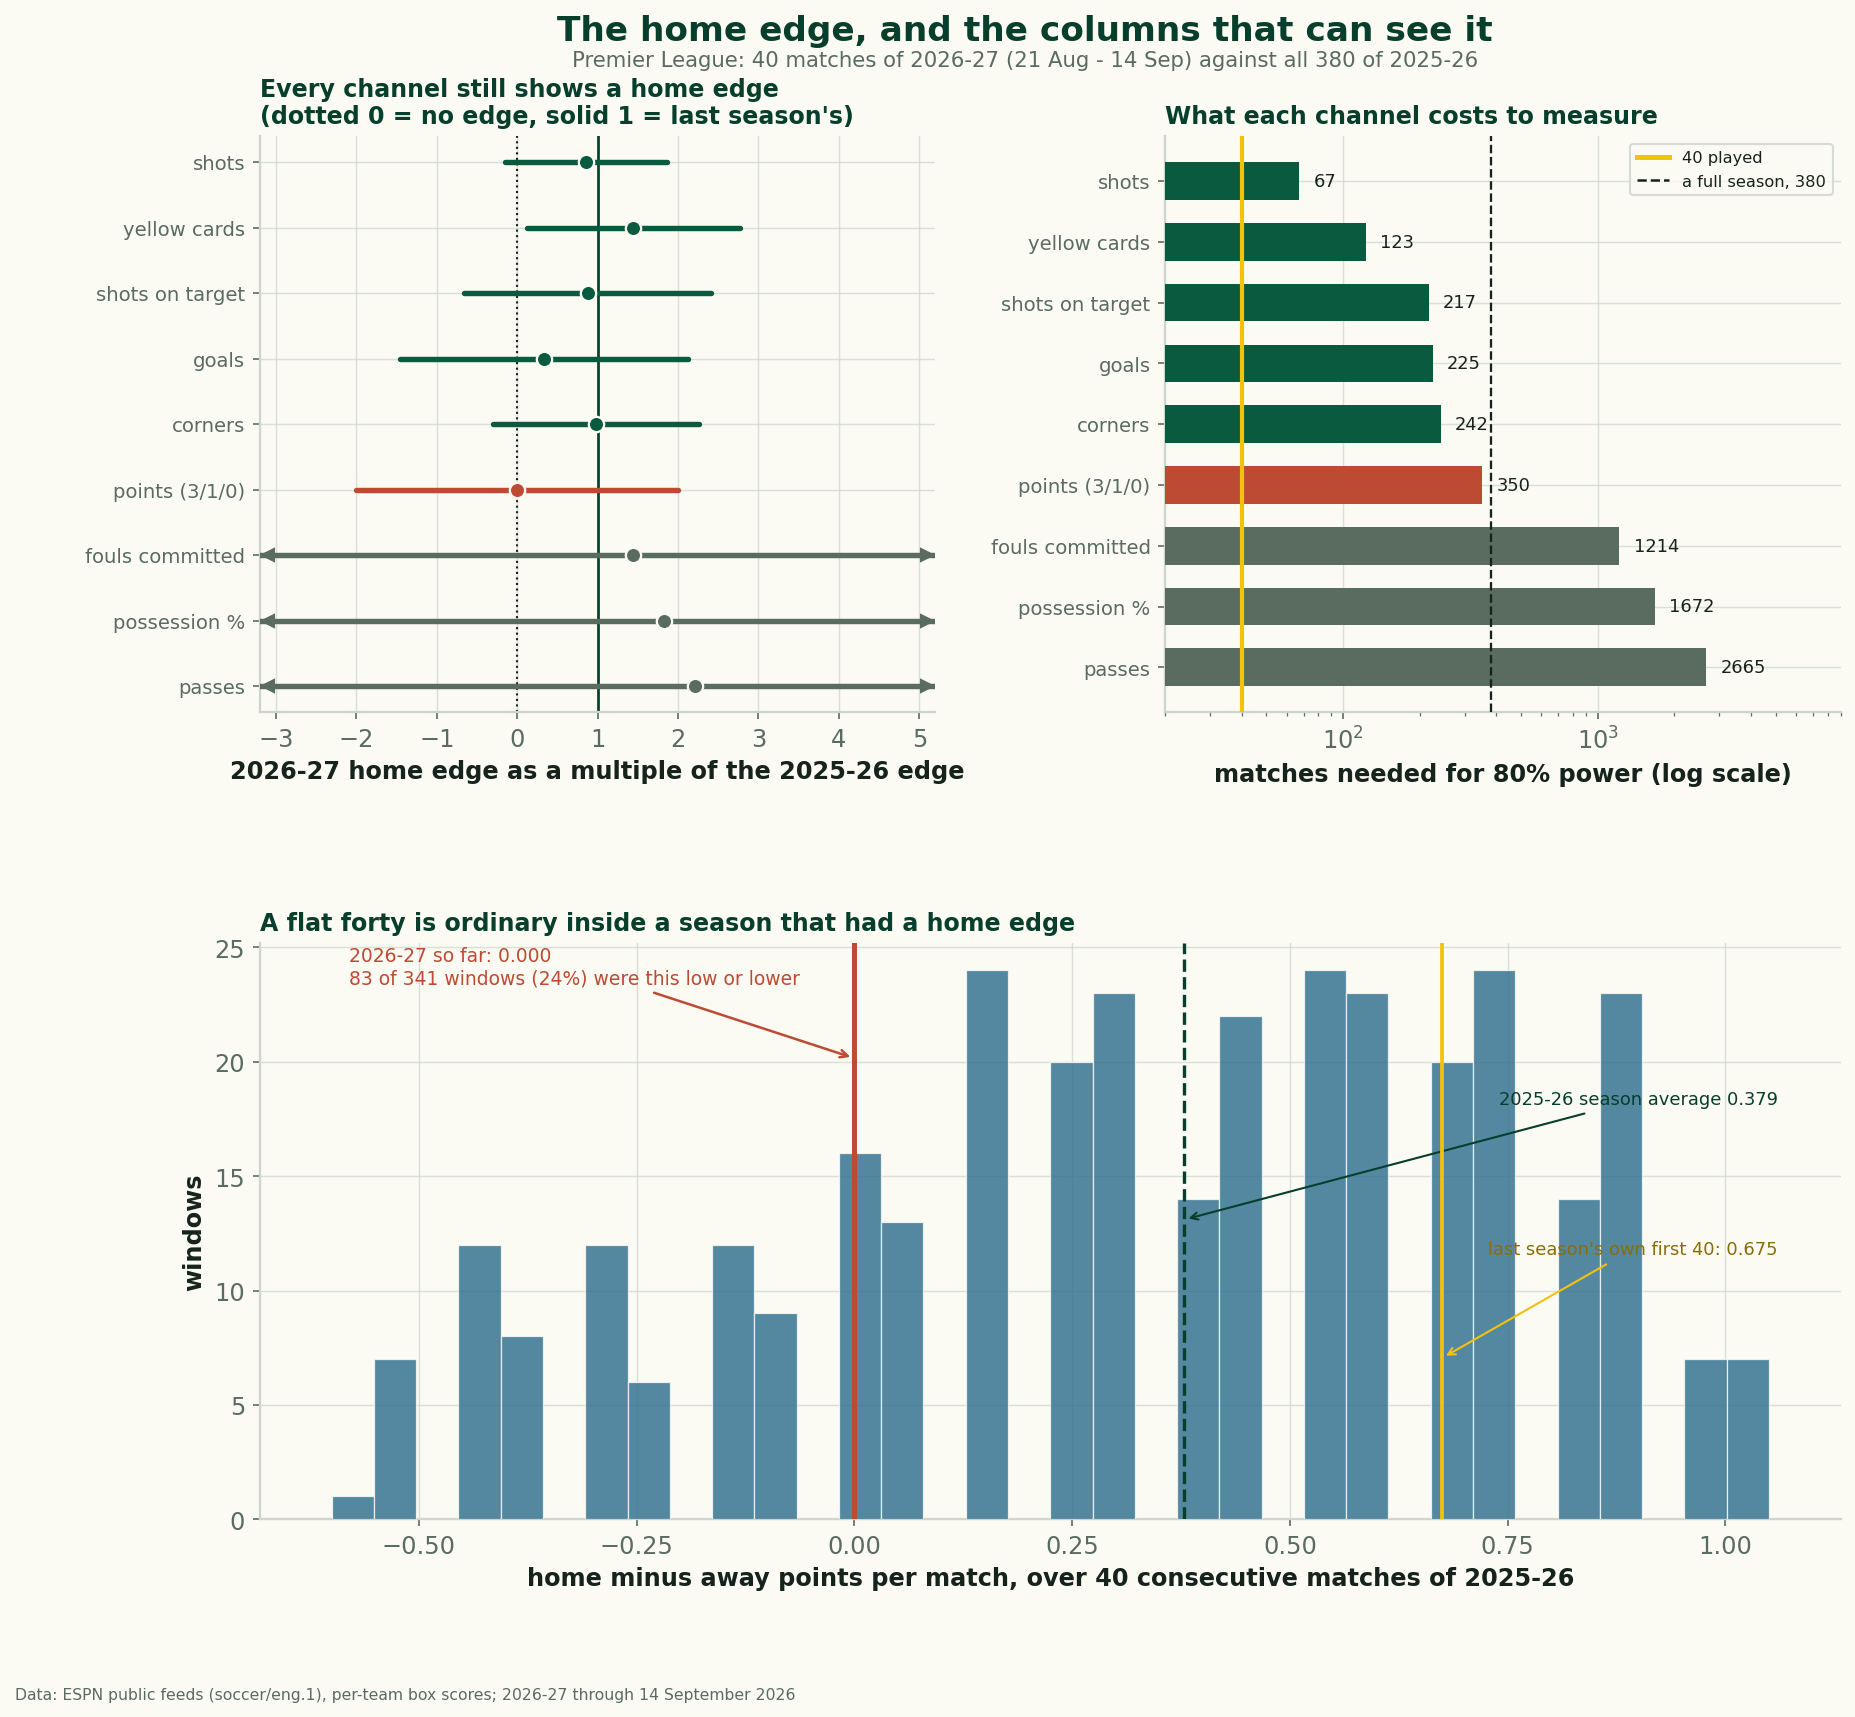
Home Advantage Didn't Die. The Results Column Can't See It
Home and away split the first 40 matches of 2026-27 evenly, yet the shot, corner and card columns keep the home edge. Plus a decade of home-advantage data.