Simulating the Knockout Rounds: Why Favourites Lose More Than You'd Think
A favourite that wins 70% of its matches still clears five rounds only about one time in six. Here is the arithmetic.
Ask someone to name the best team left in a knockout bracket and they will answer with conviction. Ask them how often that team actually lifts the trophy and the conviction wobbles, because the honest answer is "less than you think." A single-elimination tournament is a machine for converting small per-match edges into large doses of randomness, and the only way to feel that properly is to simulate it — to play the bracket out thousands of times and count the endings. This piece is about how that simulation works, why it keeps embarrassing the favourite, and where its answers stop being trustworthy. You can run one yourself at the bottom of the page; the World Cup 2026 simulator is embedded inline so you can watch a top side fail to win as often as your gut insists it should.
What a knockout simulation actually is
Strip away the interface and a tournament simulation is a loop. You give every team a strength number. You write down a rule that turns two strength numbers into a match result — usually a goal model, where the rating gap sets how many goals each side scores on average and the actual scoreline is drawn at random around those means. Then you play the whole bracket once: every tie resolved by the goal model, the winner advancing, until one team is left holding the trophy. That is a single simulated tournament. Do it once and you have learned almost nothing — it is one roll of a very large set of dice. Do it ten thousand times and tally how often each team reached each round, and those tallies become probabilities: the share of simulated tournaments a team won is its title odds under your assumptions.
The phrase "under your assumptions" is doing heavy lifting, and I'll come back to it. But the core machinery is genuinely that simple. There is no oracle inside, no secret knowledge of who is in form — just a strength rating, a match model, and a very patient loop. The methodology in prose, with the modelling choices spelled out, lives in how a World Cup simulation works; here I want to dwell on the result that surprises people most.
Why favourites lose: the arithmetic of compounding
Here is the heart of it. Suppose you have a genuinely excellent team — strong enough that, in any single match against the kind of opponent it will face in a deep bracket, it wins 70% of the time. That is a big edge; most real favourites are nowhere near that dominant against fellow survivors. Now ask the question that matters: how often does this team win five straight matches to take the trophy?
The answer is not 70%. It is 0.70 multiplied by itself five times, because the team has to win the first match and the second and the third and the fourth and the fifth. That product is 0.705 ≈ 0.168 — about one tournament in six. A team you would describe, with total justification, as the clear best side in the field still fails to win the thing more than 80% of the time. Drop the per-match win rate to a still-excellent 60% and the title probability collapses to 0.605 ≈ 0.078, fewer than one run in twelve. The edge that feels enormous over a single match is eaten alive by the requirement to repeat it.
70% per match over 5 rounds → 0.705 ≈ 16.8%.
60% per match over 5 rounds → 0.605 ≈ 7.8%.
The favourite's edge survives one match; it does not survive five.
Flip the same arithmetic around and you see why upsets feel so common at tournaments. The probability that the favourite does not win is 1 minus its title chance — better than 83% in the 70%-per-match case. Somebody other than the best team wins most of the time, not because the best team is overrated, but because single-elimination is a format that hands the field, collectively, more chances than it hands the single strongest entrant. Spread a little win probability across thirty-one other teams and their combined claim on the trophy dwarfs the favourite's. This is the structural reason the favourite wins less often than its quality suggests, and it is baked into the bracket before a ball is kicked.
One big chance, replayed: a hypothetical to feel the variance
Numbers on a page are bloodless, so picture a clearly-labelled hypothetical. Two teams meet in a quarter-final. Team A is the better side — say the goal model gives it a 1.6 expected-goals night against Team B's 1.1. Feed those into the kind of scoreline distribution the expected-points model uses and Team A is the favourite, but only at roughly a coin-flip-and-a-bit: it wins maybe a little under half the time outright, with a big slice of draws that then go to penalties, where its edge nearly vanishes. Over a league season, A finishes comfortably above B and nobody argues. Over this one match, B goes through often enough that when it happens, it barely qualifies as a shock. (Those xG figures are an illustrative construction to show the mechanism — not a real or predicted fixture.)
Now chain four of those nights together. Even if A were a slight favourite in each, the chain of "win, then win, then win again" is where the favourite's hold loosens. The simulation does this chaining for you, thousands of times, and the title-odds column it spits out is just the honest accounting of how rarely the chain completes. That is the whole value of running it rather than reasoning about a single tie: a human brain anchors on "A is better, so A goes through," while the simulation patiently reminds you that "better in each match" and "wins the bracket" are very different claims separated by an exponent.
Run it yourself
The simulator below plays the real 48-team, 12-group World Cup 2026 format — twelve groups of four, top two plus the eight best third-placed teams into a 32-team knockout — over as many Monte-Carlo tournaments as you like. Crucially, it ships with generic placeholder teams and ratings that you overwrite: it knows nothing about the actual 2026 results, draw, or standings, and it never will. Set your own strengths, run a few thousand tournaments, and watch the title-odds column. Even the team you rate highest will rarely clear much past a quarter of the simulated titles. Then nudge one rating up and re-run to feel how little the answer moves — that insensitivity is the variance of the format talking.
This simulator needs JavaScript. The method: simulate each group as a round robin with Poisson goals (scoring rate set by the rating gap), rank by points then goal difference, advance the top two of each group plus the eight best third-placed teams into a 32-team knockout decided by the same goal model, and repeat thousands of times to estimate each team's advance and title odds. It uses placeholder teams you edit — no real 2026 results are encoded.
Open the full simulator on its own page →
What the simulation tells you
Used honestly, a knockout simulation answers a specific and useful set of questions. It tells you the shape of the variance: how flat the title race is, how much of the field has a realistic claim, how steeply a team's chances fall as it has to survive more rounds. It tells you the sensitivity of the outcome to your inputs — change a rating and see whether the odds lurch or barely flinch, which reveals how much the bracket is decided by strength versus luck. It gives you a baseline against which to judge a real result: if a side you rated middling reaches a semi-final, the simulation tells you whether that was a one-in-three fluke or a one-in-fifty miracle. And it makes the compounding visceral in a way no single probability does, because you watch favourite after favourite fall out across the runs.
What it does not tell you
The cautions matter as much as the capabilities, and a simulation that you trust uncritically is worse than no simulation at all. First, it is only as good as the ratings you feed it — garbage strengths in, confident-looking garbage out. The crisp percentages tempt you to forget they rest on a number you essentially guessed. Second, it assumes a stable model of a match: it has no idea about a key suspension, a tactical mismatch, a team that raises its level for big games, fatigue from a brutal travel schedule, or the simple fact that knockout football is often cagier and lower-scoring than the group stage. Third, independence between rounds is an approximation — a team that grinds through extra time twice may be more vulnerable in the next round than a fresh opponent, and the basic model misses that. Fourth, and most important here, it is emphatically not a forecast of the real tournament: it is a property of your assumptions and the format's structure, a teaching instrument, not a prediction of or commentary on actual matches. The deeper warning against reading too much into any single bracket — simulated or real — is laid out in don't overfit the knockouts.
How to read a simulation well
Treat the title-odds column as a distribution, not a verdict. The useful read is rarely "this team will win" — it is "no single team is close to a favourite," or "my top two ratings barely separate at the top," or "the field is so deep that the trophy is genuinely up for grabs." Run the thing multiple times with deliberately different ratings to see which conclusions are robust to your uncertainty and which evaporate the moment you admit you might be wrong about a team. Watch how the per-stage odds decay round by round, because that decay is the compounding, made into a column you can point at. And hold the whole exercise at arm's length from the real World Cup: the simulator models the mathematics of a 48-team bracket beautifully and tells you nothing whatsoever about who is actually winning in 2026. Used that way — as a lens on variance rather than a window onto the future — it is one of the most honest tools in the analytics kit, precisely because it keeps refusing to crown your favourite as often as you would like.
Sources & further reading
- Free textbook: Chapter 20: Predictive Modeling — the theory behind this, at DataField.dev.
- How a World Cup Simulation Works — the modelling choices behind the loop, in prose.
- How Often the Favourite Actually Wins — why knockout football is so volatile.
- Don't Overfit the Knockouts — the danger of reading too much into one bracket.
- World Cup 2026 Simulator — the full Monte-Carlo model on its own page, ratings entirely yours.
- Expected Points from xG — how a single match's chances become win/draw/loss probabilities, the per-match input a bracket compounds.
More from World Cup 2026
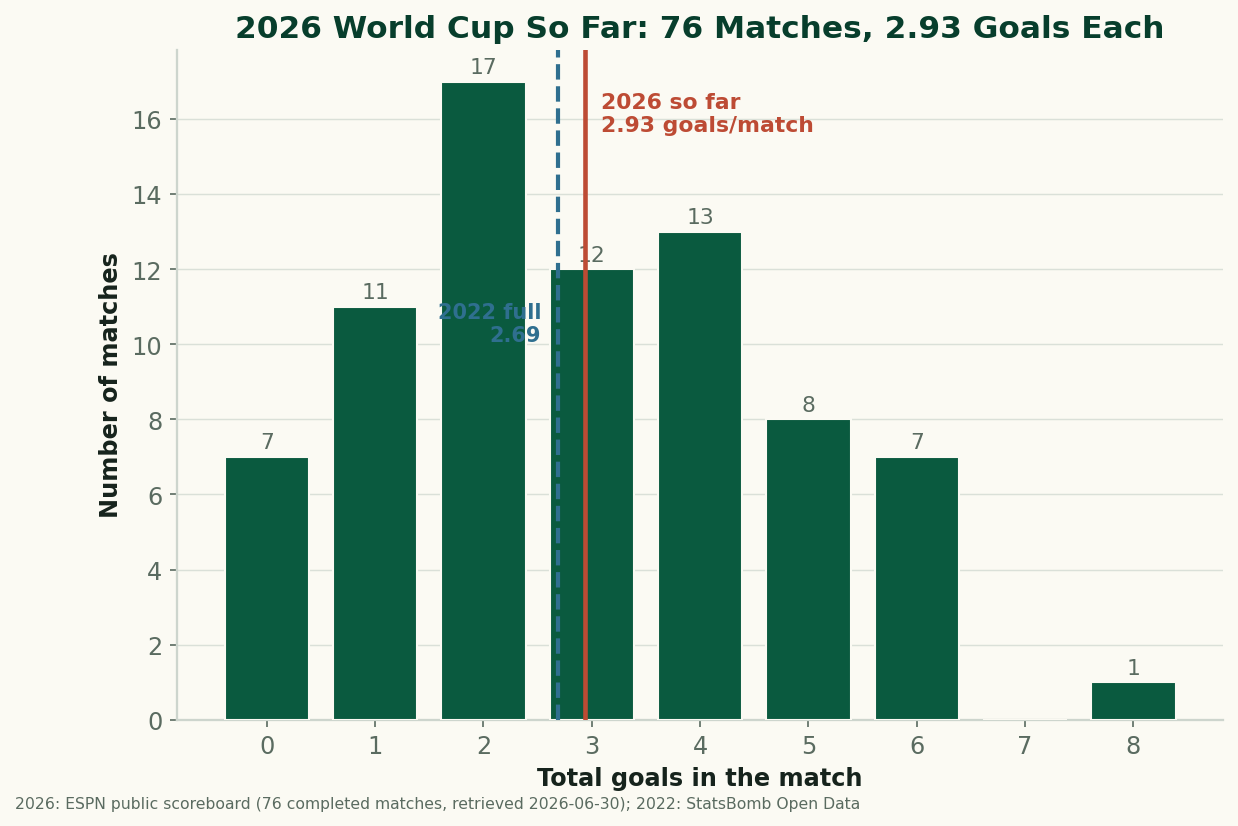
The 2026 World Cup So Far, By the Numbers: Just Under 3 Goals a Game
Through 76 completed matches, the 2026 World Cup is still outscoring 2022 — 2.93 goals a game to 2.69. After an early spike the rate has settled just under 3 a game. The real, sourced numbers on goals, draws, and the blowouts behind them, with honest caveats about a group-stage-only sample. (A living snapshot, refreshed as games are played.)
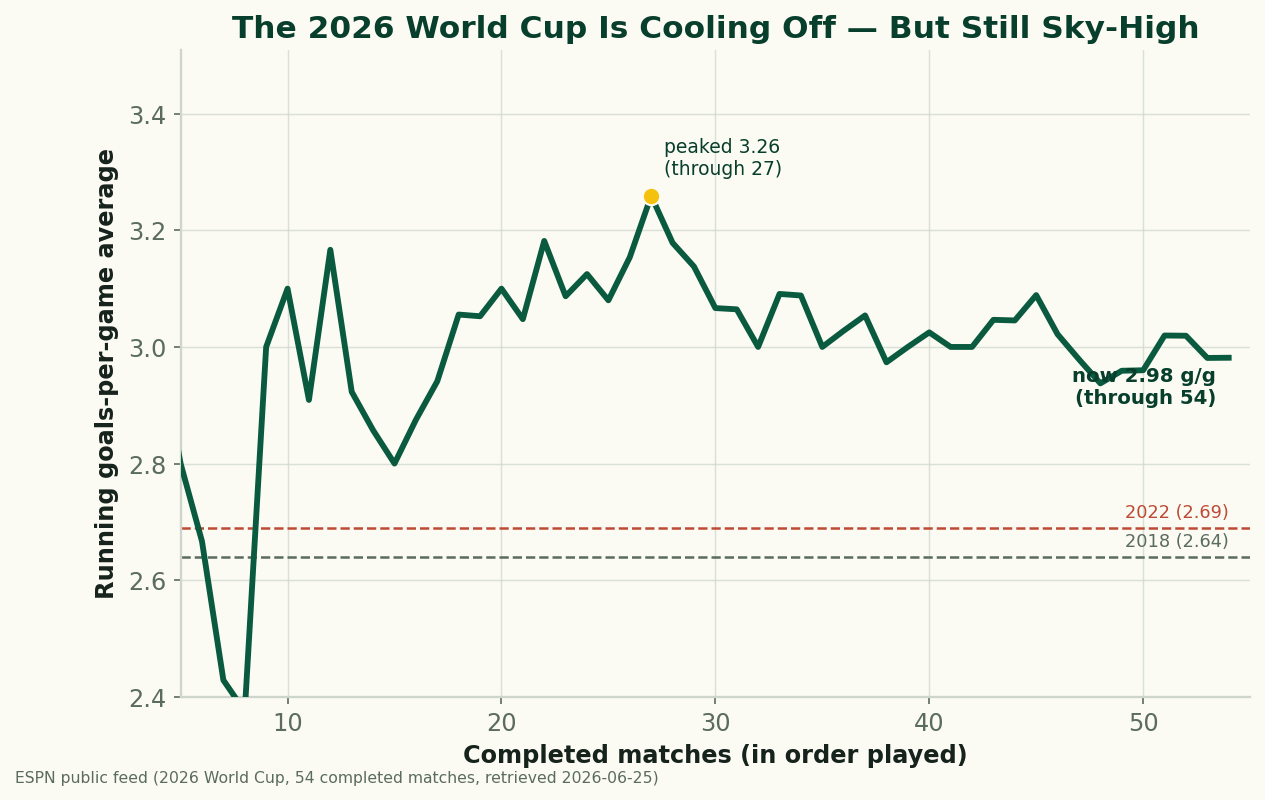
The 2026 World Cup Is Cooling Off — and Still the Highest-Scoring in Generations
Through 54 completed matches, the 2026 World Cup is averaging 2.98 goals a game — down from a blistering 3.26 early on, but still comfortably above 2022 (2.69) and 2018 (2.64), and the highest-scoring World Cup since 1970. A refreshed look at where the goals are going as the group stage closes.
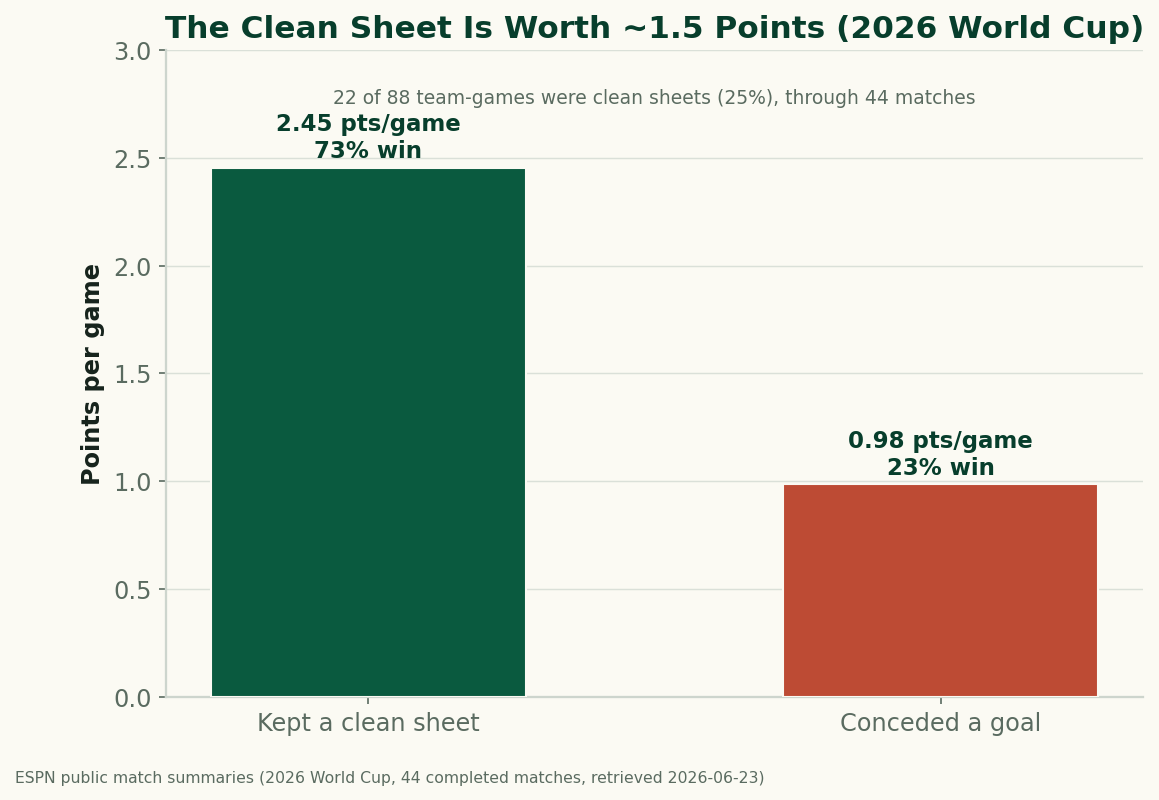
The Clean Sheet Is the Most Valuable Thing at the 2026 World Cup
Through 44 completed matches, a team that keeps a clean sheet at the 2026 World Cup averages 2.45 points and wins 73% of the time; a team that concedes averages under 1. Don't concede and you almost can't lose — the data on what a clean sheet is worth.