A Handful of Chances Decide a World Cup
Half the shots at a World Cup are near-hopeless. A thin sliver of big chances does almost all the scoring. The case against counting shots.
Not all shots are remotely equal, and the degree of inequality is the thing that breaks the shot count as a statistic. Take every open-play attempt from the 2022 World Cup and line them up from worst to best by expected goals, and the distribution is brutally top-heavy. Nearly half of all shots — 47.8% — carried less than a 1-in-20 chance of going in, and that entire half produced just 18 of the tournament's 152 open-play goals. Meanwhile the best 5% of shots, a mere 71 attempts, delivered 28% of every goal scored. A World Cup is not decided by who shoots more. It is decided by who manufactures the handful of chances that are actually worth something.
Sourcing. Every number is computed from StatsBomb's free 2022 World Cup data, all 64 matches: 1,430 open-play shots (penalties excluded), each with a model xG. The median, the shares, and the bands below are read straight off that file. Nothing is invented.
The exhibit: shots grouped by how good they were
| Chance quality (xG) | Shots | Share of shots | Share of total xG | Goals | Share of goals | Conversion |
|---|---|---|---|---|---|---|
| Under 0.05 (worse than 1-in-20) | 684 | 47.8% | 13.7% | 18 | 11.8% | 2.6% |
| 0.05 – 0.10 | 371 | 25.9% | 19.0% | 27 | 17.8% | 7.3% |
| 0.10 – 0.20 | 193 | 13.5% | 19.3% | 36 | 23.7% | 18.7% |
| 0.20 – 0.35 | 109 | 7.6% | 20.5% | 28 | 18.4% | 25.7% |
| 0.35 and up (big chances) | 73 | 5.1% | 27.6% | 43 | 28.3% | 58.9% |
Real values from StatsBomb Open Data, 2022 World Cup, 1,430 open-play shots. The median shot carried just 0.053 xG. Data provided by StatsBomb.
The finding: the median shot is almost worthless
The single most telling number is not in the table — it is the median. Half of all shots at the 2022 World Cup carried 0.053 xG or less. The typical World Cup shot, the one right in the middle of the distribution, had about a one-in-twenty chance of scoring. When a commentator says a team "had a go," this is usually what happened: a low-value effort that the base rate says fails nineteen times out of twenty.
Stack the bottom two bands together and the point sharpens. The 1,055 shots below 0.10 xG — nearly three-quarters of every attempt in the tournament — produced 45 goals between them. The 182 shots at 0.20 or better, barely one shot in eight, produced 71. Danger is not spread across the shot chart; it is concentrated in a corner of it. The bottom of the distribution is filler, and the top is where tournaments are won.
How concentrated? The 5% that carry the load
Sort all 1,430 shots by xG and take the top slice:
- Top 5% (71 shots) — 27.1% of all the expected goals in the tournament, and 28.3% of the actual goals.
- Top 10% (143 shots) — 41.9% of the xG, 40.1% of the goals.
- Top 20% (286 shots) — 62.5% of every goal scored.
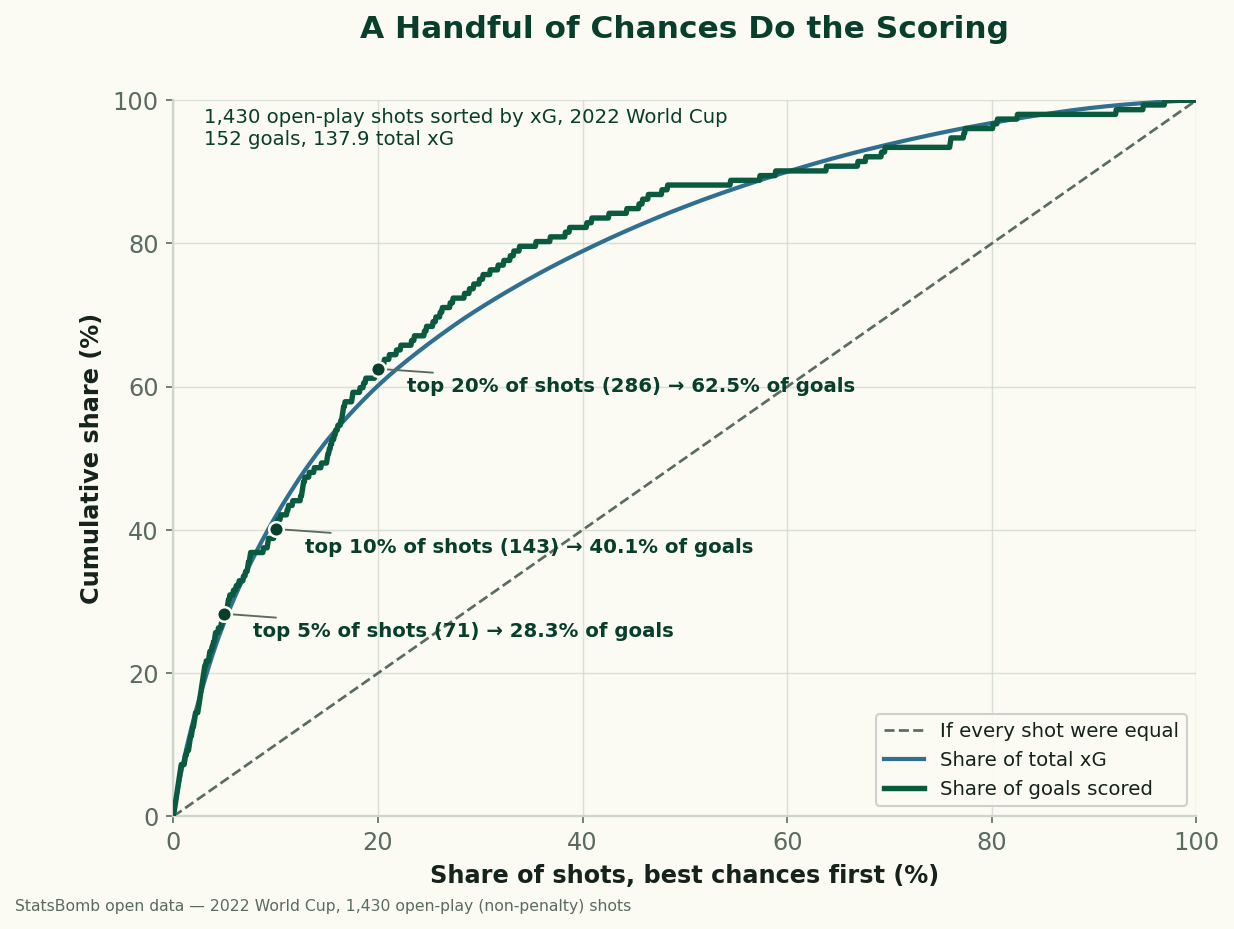
One shot in twenty did more than a quarter of all the scoring. One shot in five did nearly two-thirds. This is a Pareto distribution in football boots: the good chances are rare and they dominate, while the long tail of speculative efforts contributes almost nothing but noise to the shot count. It is the same lesson the overrated cross and the map of where goals come from keep teaching from other angles: volume is cheap, quality is scarce.
A worked example: two teams, same shot count
Suppose two sides each finish a match with 15 shots. Team A took the average 2022 diet — roughly seven shots under 0.05, four in the 0.05–0.10 band, and the rest scattered upward, with no single attempt above 0.35. Its expected haul is on the order of one goal. Team B took 15 shots too, but three of them were big chances at 0.35 or better. Using the 58.9% conversion those command, Team B expects nearly two goals from those three alone, before counting the other twelve. Identical shot counts; wholly different matches. The scoreline "15 shots each" is not just uninformative, it is actively misleading — which is the entire reason expected goals was invented, and why weighting each shot by its quality tells you more in one number than the count ever could.
Why this matters for reading a tournament
The concentration explains why single knockout matches are so violently random. If almost all the scoring comes from a thin sliver of big chances, then a match often turns on whether a team converts its two or three real openings — and at 59% each, converting or missing a big chance is close to a coin flip. Over a league season the coins land near their expected value and the table sorts itself out. Over one game, a team can create the better chances and lose because its two 0.6-xG efforts both missed. That is not a failure of the model; it is the model telling you honestly that the sample is too small to trust the result, which is the case for not overfitting the knockouts.
The honest caveats
- Concentration is partly by construction. xG is bounded at 1, so high-value shots are inherently scarce and inherently do most of the scoring; some of the top-heaviness is definitional. The non-trivial part is how extreme it is here — a median of 0.053 is a genuinely low typical shot.
- Bands are arbitrary cutoffs. The 0.05 and 0.35 lines are our choices; sliding them would move the shares. The ranking and the top-5%-does-28% figures do not depend on the bins, though.
- One model, one tournament. A different xG model would value the tail slightly differently, and 1,430 shots is one World Cup. The shape — a long cheap tail and a heavy top — is common across competitions, but the exact numbers are 2022's.
- The tail is not literally zero. Eighteen goals did come from sub-0.05 shots — the screamer from 30 yards is real, just rare. "Nearly worthless" is not "worthless," and a team that never shoots from distance forfeits those eighteen.
The takeaway
Half the shots at a World Cup are barely worth taking, and a thin top slice does almost all the damage: the best 5% of chances accounted for 28% of every goal in 2022. The shot count treats a 30-yard hopeful and a six-yard tap-in as one apiece, which is why it is close to useless as a measure of who was dangerous. Count big chances instead — the 0.35-and-up shots that go in nearly three times out of five. When you watch a match, forget how many times each side had a go; ask how many times each side had a real one. Usually the answer is a handful, and that handful is the game.
Reproduce it
From data_layer/wc2022_shots.json, drop penalties, sort the 1,430 shots by xg, and compute the median. For the concentration figures, sum the xG and count the goals in the top 5/10/20% of the sorted list and divide by the tournament totals (137.9 xG, 152 goals). For the table, bucket shots into the xG bands and tally each. No network at build time, nothing hand-entered.
The data behind this piece
- Shot & xG data: StatsBomb open data (free public dataset; attribution required), FIFA World Cup 2022, all 64 matches, bundled as
data_layer/wc2022_shots.json. Data provided by StatsBomb. - Companion: where goals are scored from and the overrated cross.
- Background: expected goals explained · don't overfit the knockouts.
More from Data Deep-Dives
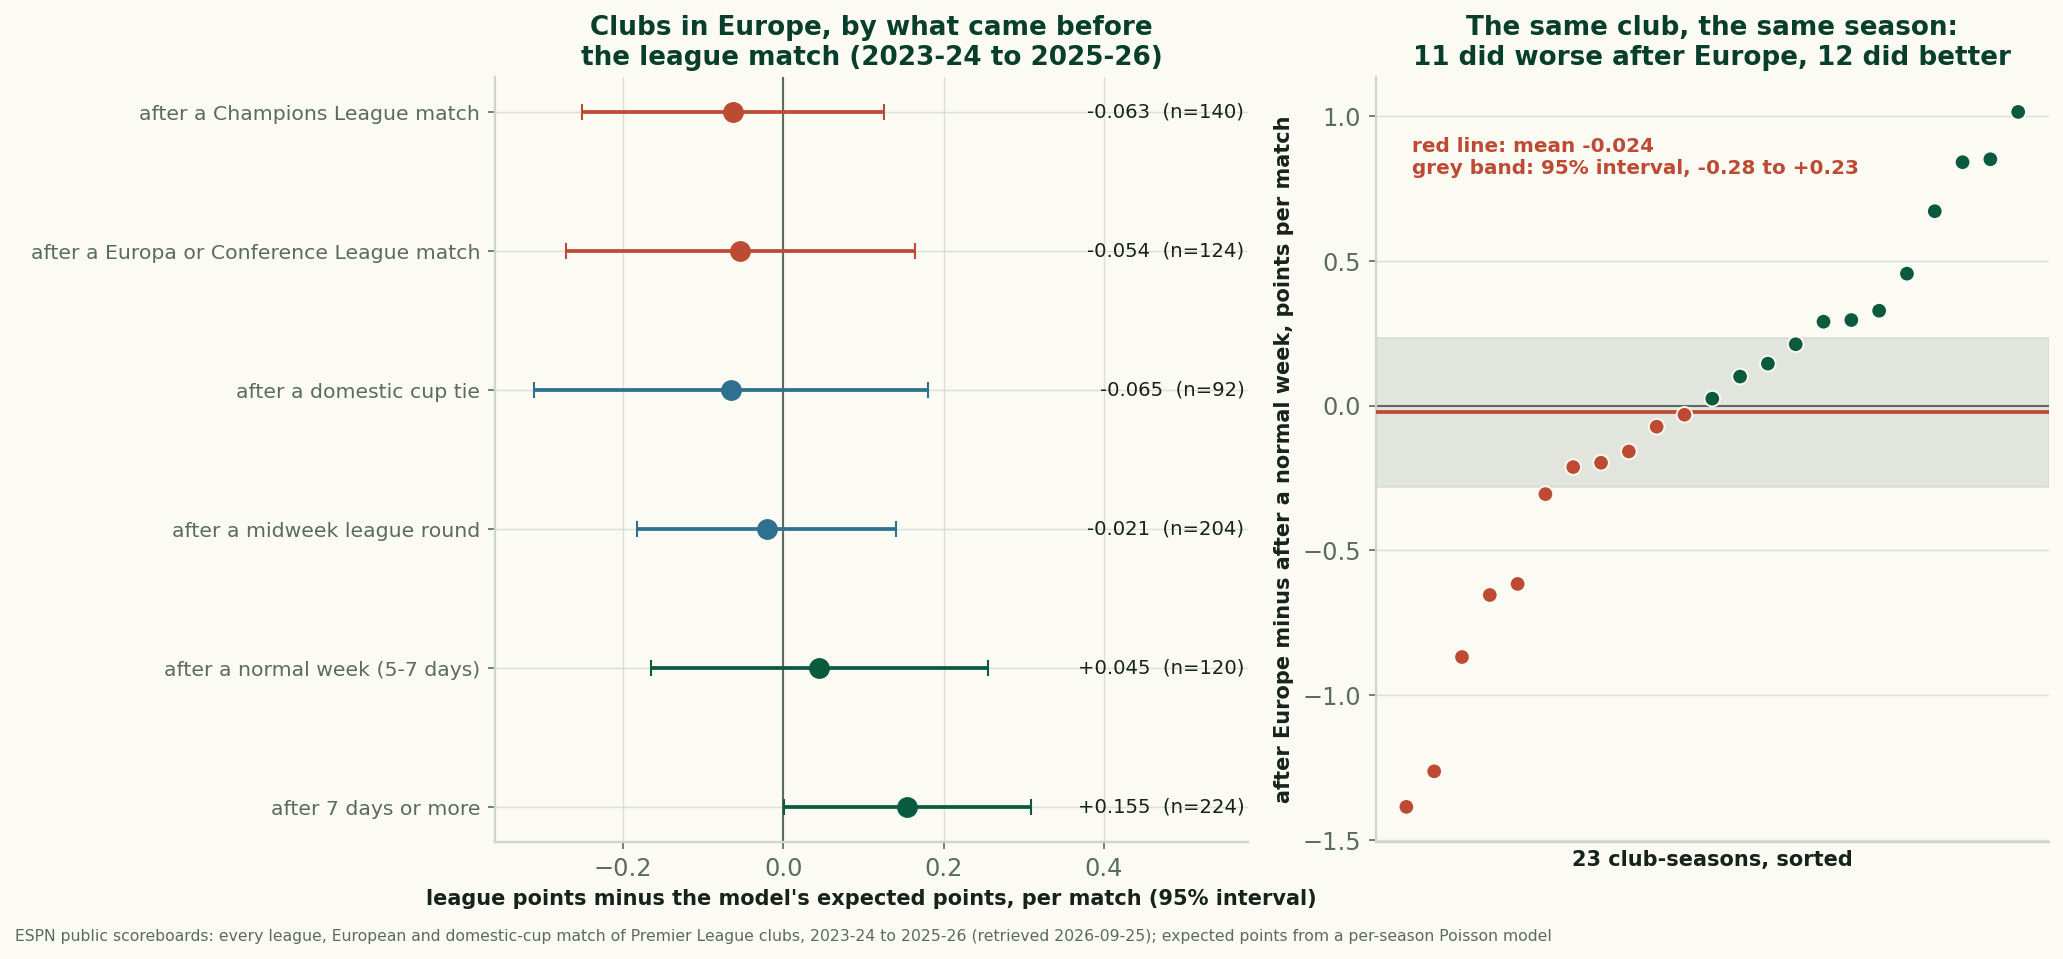
Does Europe Cost English Clubs at the Weekend? Three Seasons Can't Find It
After a European night, English clubs took 1.56 league points a match against 1.62 expected. Within the same club and season the gap is -0.024: not measurable.
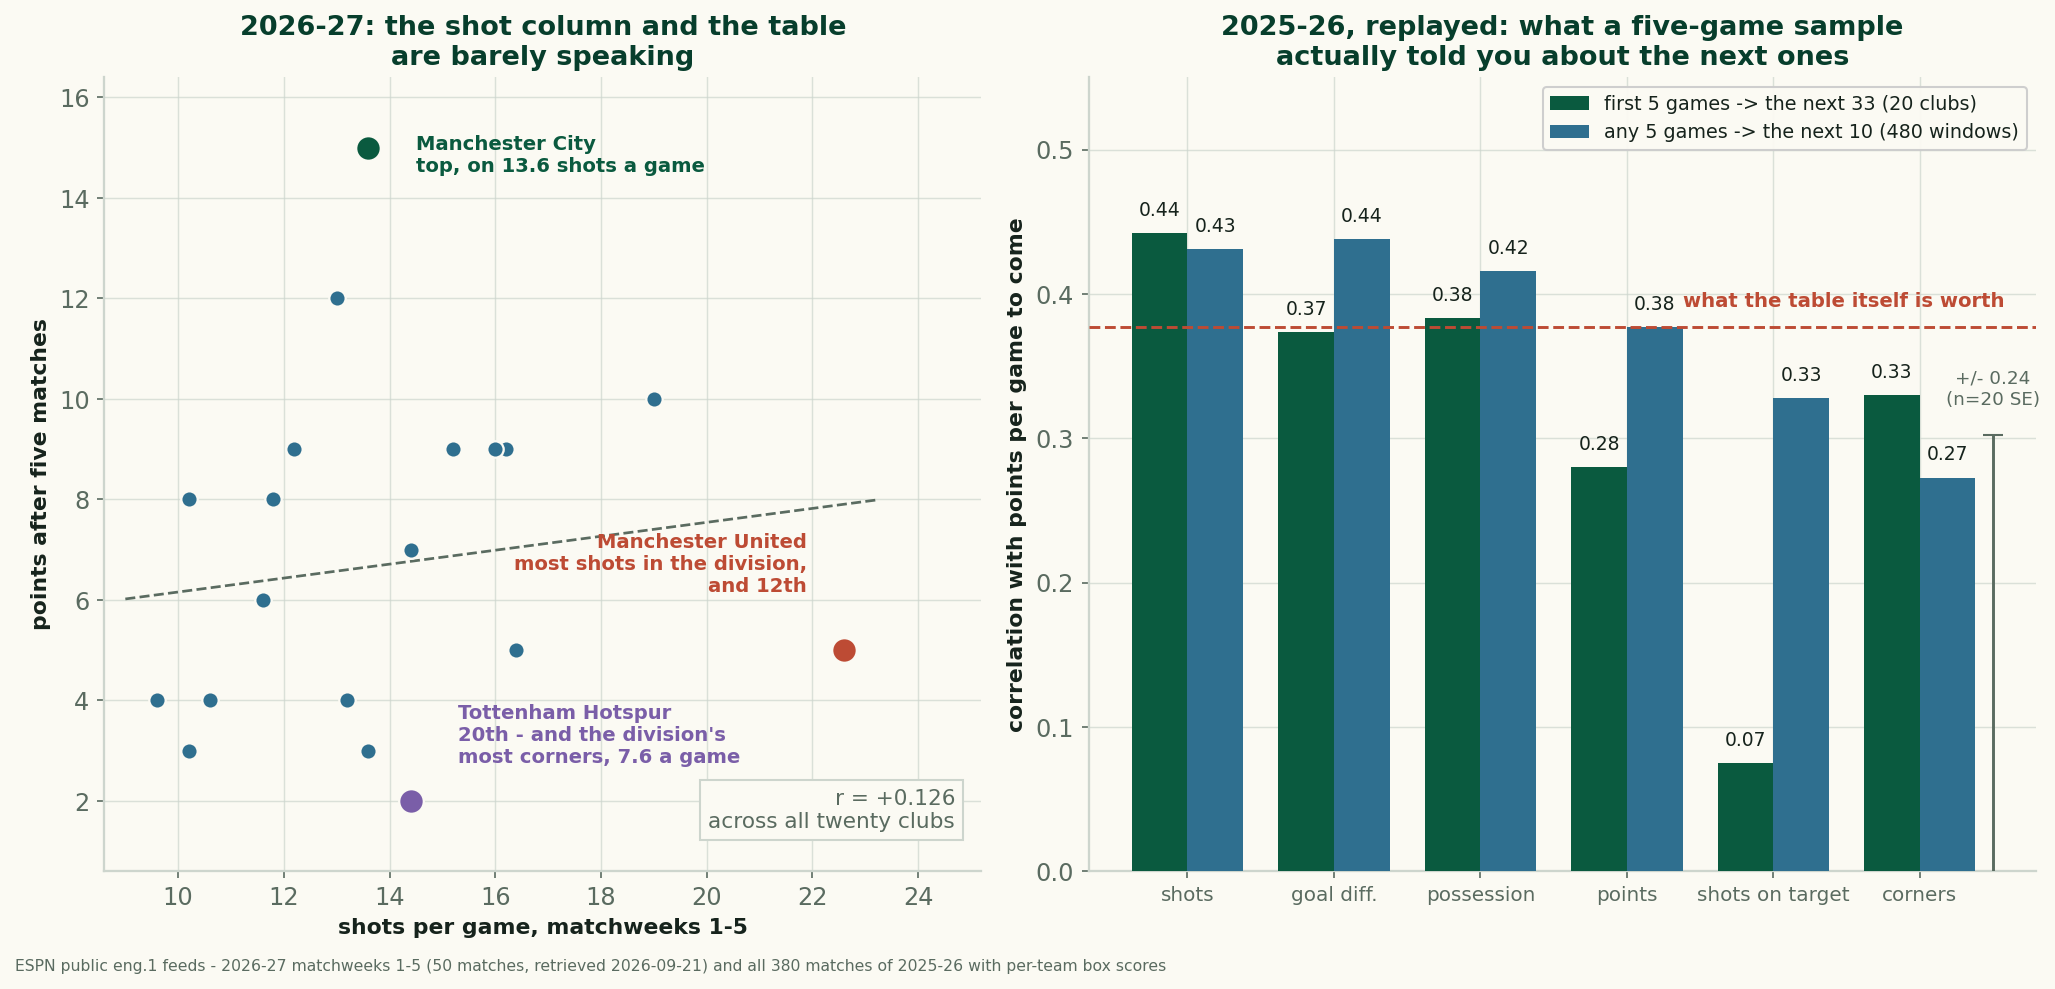
Manchester United Lead the League in Shots and Sit Twelfth
United take 22.6 shots a game and have 5 points. Across 2025-26, a club's five-game shot count predicted its next results better than its points did.
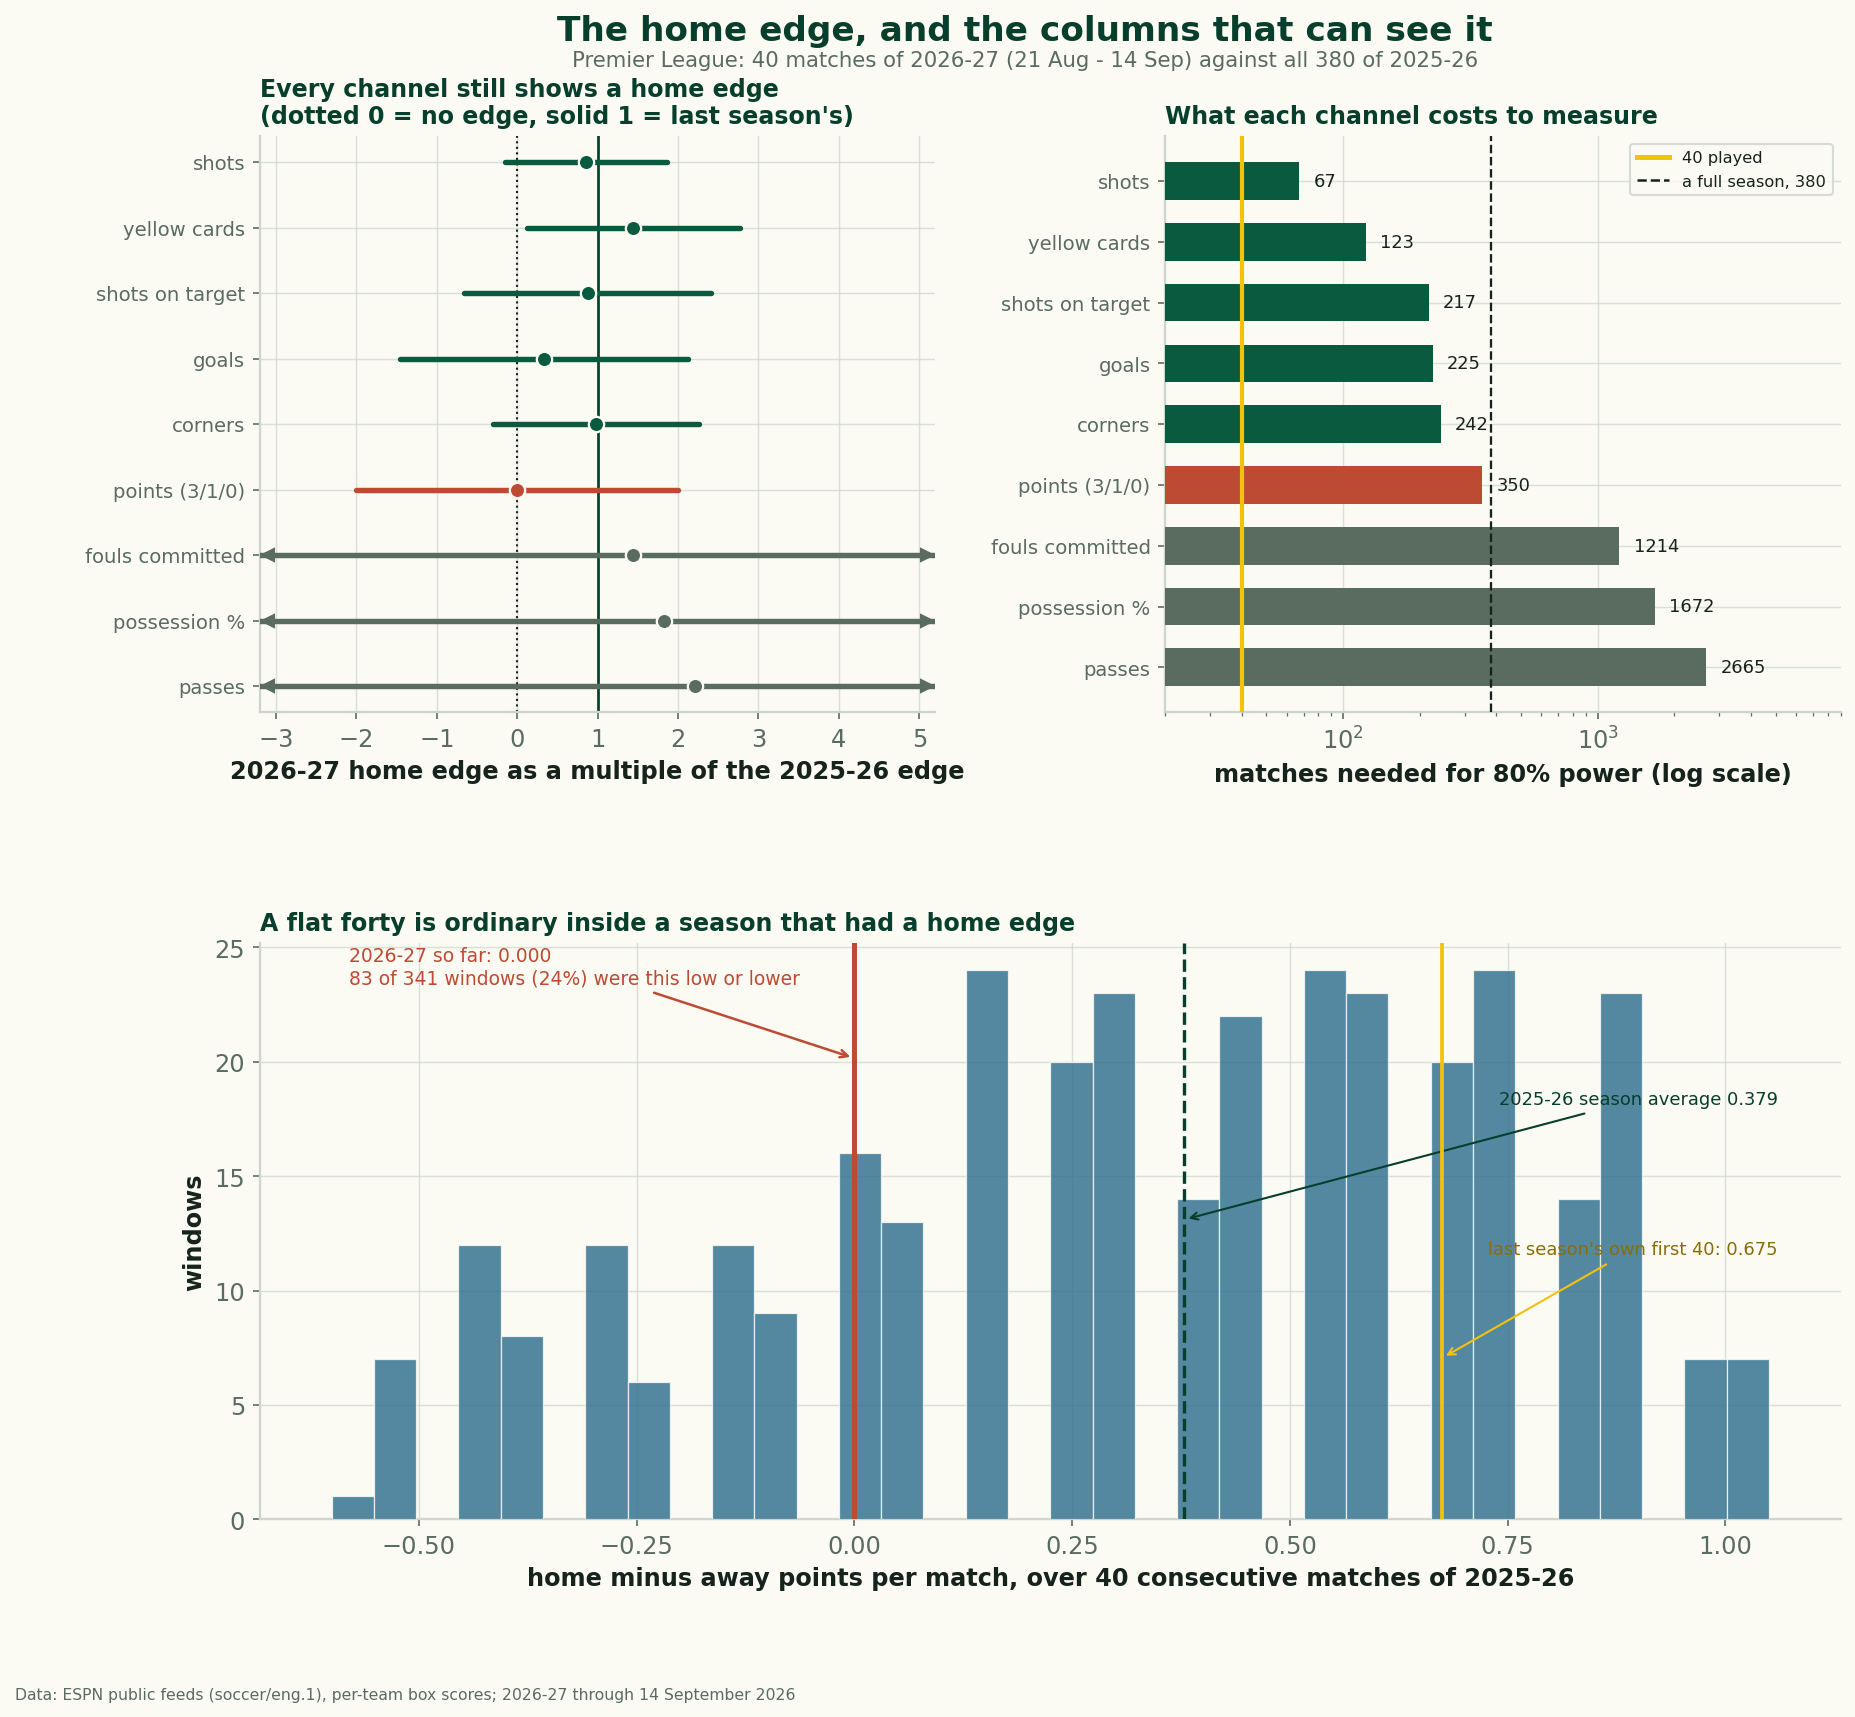
Home Advantage Didn't Die. The Results Column Can't See It
Home and away split the first 40 matches of 2026-27 evenly, yet the shot, corner and card columns keep the home edge. Plus a decade of home-advantage data.