How Models Rate the Field Before a World Cup Is Played
One number per team, turned into a tournament pecking order.
Long before the first whistle of a World Cup, the forecasts arrive: this team is the favourite, that one a live outsider, this group the group of death. None of it comes from watching the tournament, because the tournament has not happened. It comes from a number — a single power rating attached to every nation — and a method for turning the gaps between those numbers into the probability that any given team lifts the trophy. This is how that pipeline works, and, just as importantly, what it cannot tell you.
The rating is the foundation
Everything starts with a strength estimate for each team. The two reference families are the ones that run through all of football modelling. Elo, borrowed from chess, assigns every side one rating and updates it after each match by transferring points from one team to the other, with the size of the swing scaled by how surprising the result was and — in the football versions — by the margin of victory and where the match was played. SPI-style systems instead split a team into an attacking number and a defensive number and lean on goals and chance quality rather than results alone. The deeper mechanics of both, and why two reputable systems hand you different numbers on purpose, are covered in soccer power ratings: Elo, SPI and why they disagree.
For international football, the rating problem is harder than for clubs. National teams play infrequently, in fits and starts, with squads that change between camps. A qualifying campaign might span two years and a couple of dozen matches against wildly uneven opposition. So a pre-tournament rating is doing a lot of inference from a thin, awkward sample — which is the first reason to treat any single number with humility.
From two ratings to one match probability
A rating is only useful if it produces a match forecast. The standard move is to convert the gap between two teams' ratings into an expected goal difference, then feed that into a scoreline model — most commonly a Poisson process for each side's goals, which turns two attack-and-defence estimates into the probability of every possible result. We walk through that machinery in how win-probability models work and build a working version in the Poisson goals model in Python.
The output for a single match is not a prediction of the score. It is a distribution: maybe a 55% chance the favourite wins, 25% a draw, 20% an upset, with a spread of plausible scorelines underneath. At the knockout stage the draw is removed by extra time and penalties, and most models simply assign the shoot-out something close to a coin flip — a modelling choice that matters, and one we return to below.
From match odds to a tournament number
No single equation gives you a team's title probability, because a World Cup is a tree of contingent matches: who you meet in the last 16 depends on who wins your group, which depends on results that have not happened. The tractable answer is simulation. The model plays the entire tournament — every group game, every knockout tie — by sampling from its match distributions, records who won, and then does it again tens of thousands of times. Count the fraction of simulations a team wins, and that fraction is its title probability. The full method, and why honest modellers run it rather than reason about brackets by hand, is the subject of how a World Cup simulation works.
Two features of this fall out immediately. First, title odds are concentrated: even the strongest team in a 48-side field rarely projects above a modest share, because seven straight knockout-flavoured results is a brutal gauntlet for anyone. A pre-tournament favourite being quoted somewhere in the low double digits of percent — to use a deliberately illustrative figure, the kind of single-digit-to-mid-teens range these exercises tend to produce for a top seed, not a claim about any actual 2026 team — is normal, not a sign of an open field. Second, the draw matters enormously. A strong team handed a kind bracket can carry a meaningfully higher number than an equally strong team on the hard side of the tree.
The usual suspects, and why
One pattern is robust enough to state plainly. Over recent decades the pre-tournament favourites, and the eventual winners, have come overwhelmingly from a small set of nations — Brazil, France, Argentina, Germany, Spain, England among them. That is not a forecast for 2026; it is a description of where elite depth has historically lived. Power ratings encode it because these sides have, over long samples, beaten strong opposition repeatedly, which is exactly what a rating is built to detect.
What a rating will not do is tell you which of those contenders is correctly priced this time, or whether a side outside the group has quietly built a squad that the ratings have not caught up with. Those are the interesting questions, and they live in the gap between the model and reality — see what predicts a deep World Cup run and how to spot a dark horse.
Where these numbers go wrong
A pre-tournament rating is a point estimate wrapped in more uncertainty than its tidy decimal suggests. Three weaknesses are worth holding in mind. Squad change: a key injury or a manager's tactical overhaul late in the cycle can make a rating stale, because the rating was earned by a slightly different team. Friendly noise: warm-up results carry little signal — sides experiment, rest players, and coast — yet they move public perception far more than they should. The home and travel terms: in 2026 the tournament spans three countries and a wide range of climates and altitudes, and how a model handles venue effects is a genuine source of disagreement, explored in altitude and heat at the 2026 venues and quantified in general terms in home advantage, quantified.
The honest framing is this: a power rating gives you a defensible ordering of the field and a calibrated sense of how much better one team is than another. It does not give you the winner, and any single title percentage should be read as the centre of a wide distribution, not a measurement. The value is in the ranking and the ranges, not the false precision of one number — a theme that recurs the moment two good models disagree, which they will.
Sources & further reading
- Free textbook: Chapter 20: Predictive Modeling — the theory behind this, at DataField.dev.
- ClubElo — a long-running public Elo implementation; useful for seeing how margin of victory, home advantage and the K-factor are handled in practice.
- StatsBomb — research and event data behind chance-quality-aware ratings, and documentation on how such models are calibrated.
- FBref — international-team xG, xGA and results, the raw material for performance-aware power ratings.
- FIFA — the governing body's own world ranking and the tournament's format and structure.
More from World Cup 2026
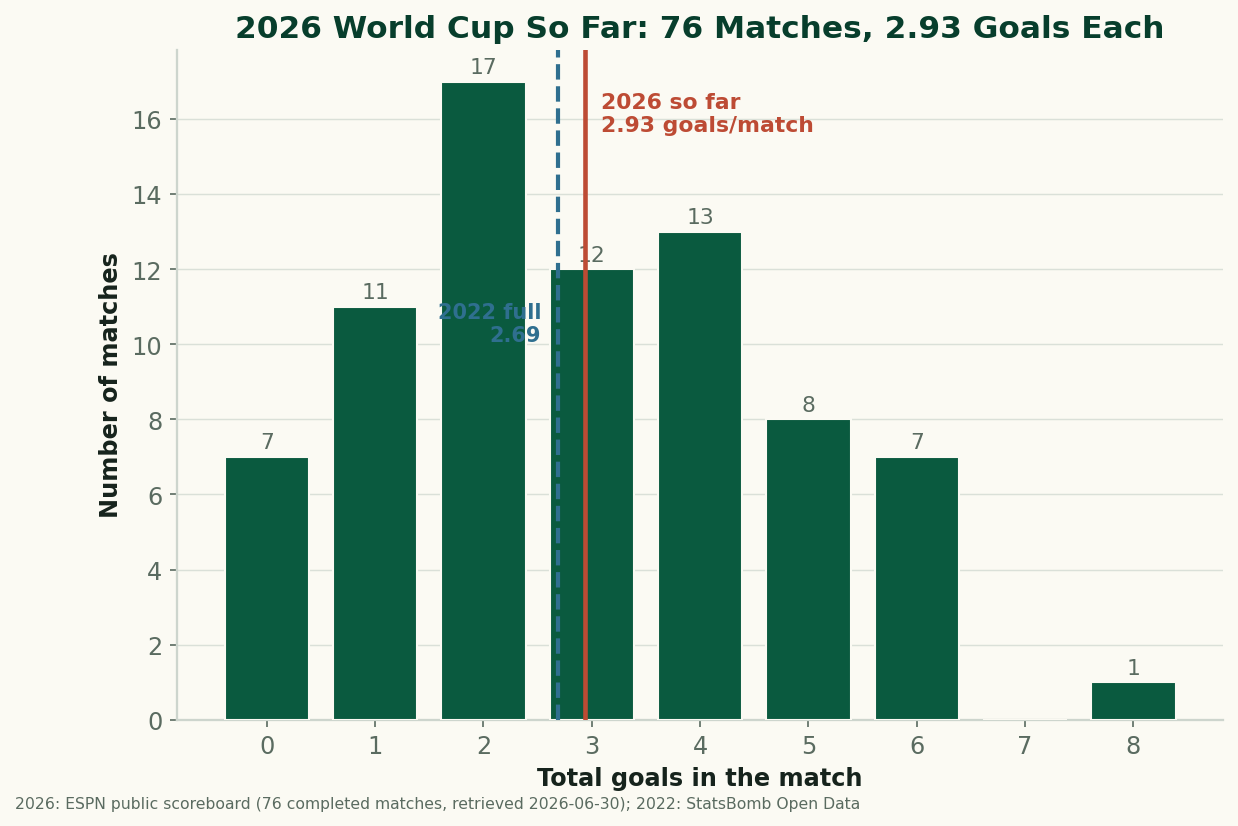
The 2026 World Cup So Far, By the Numbers: Just Under 3 Goals a Game
Through 76 completed matches, the 2026 World Cup is still outscoring 2022 — 2.93 goals a game to 2.69. After an early spike the rate has settled just under 3 a game. The real, sourced numbers on goals, draws, and the blowouts behind them, with honest caveats about a group-stage-only sample. (A living snapshot, refreshed as games are played.)
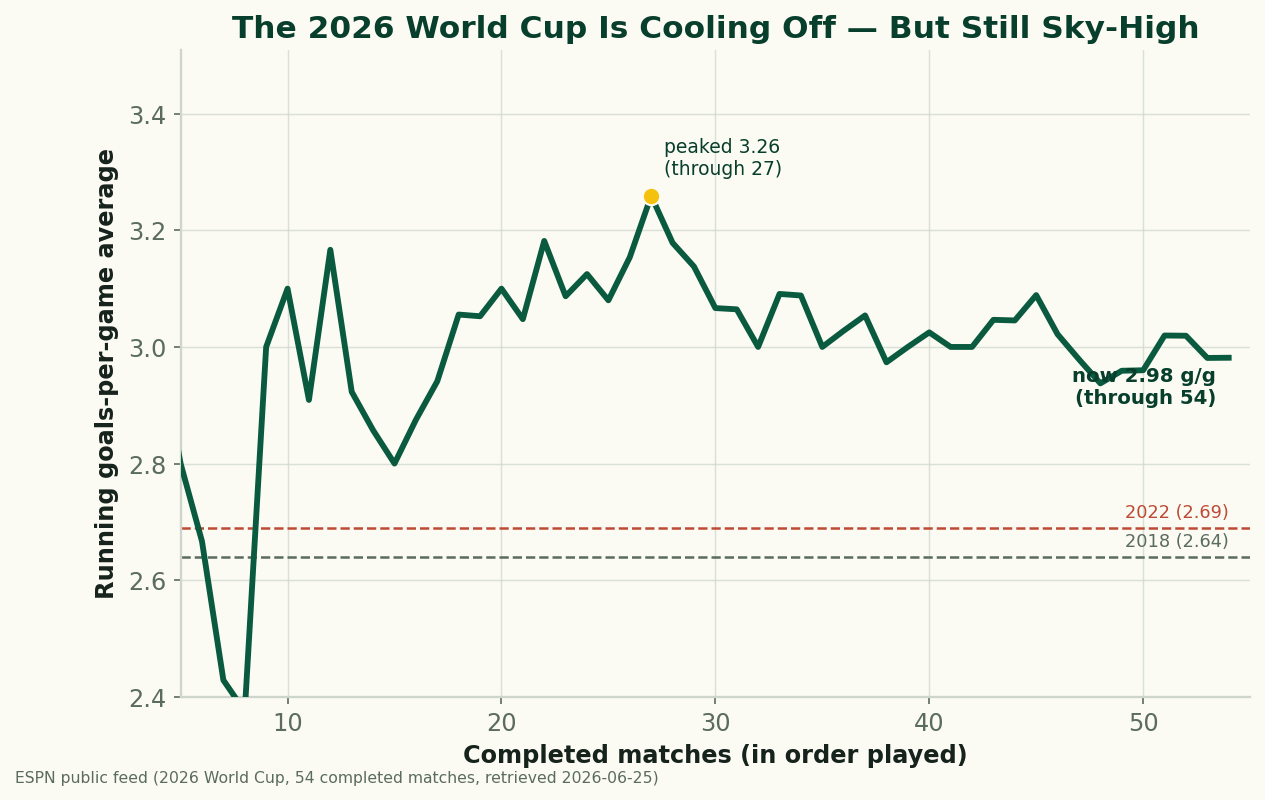
The 2026 World Cup Is Cooling Off — and Still the Highest-Scoring in Generations
Through 54 completed matches, the 2026 World Cup is averaging 2.98 goals a game — down from a blistering 3.26 early on, but still comfortably above 2022 (2.69) and 2018 (2.64), and the highest-scoring World Cup since 1970. A refreshed look at where the goals are going as the group stage closes.
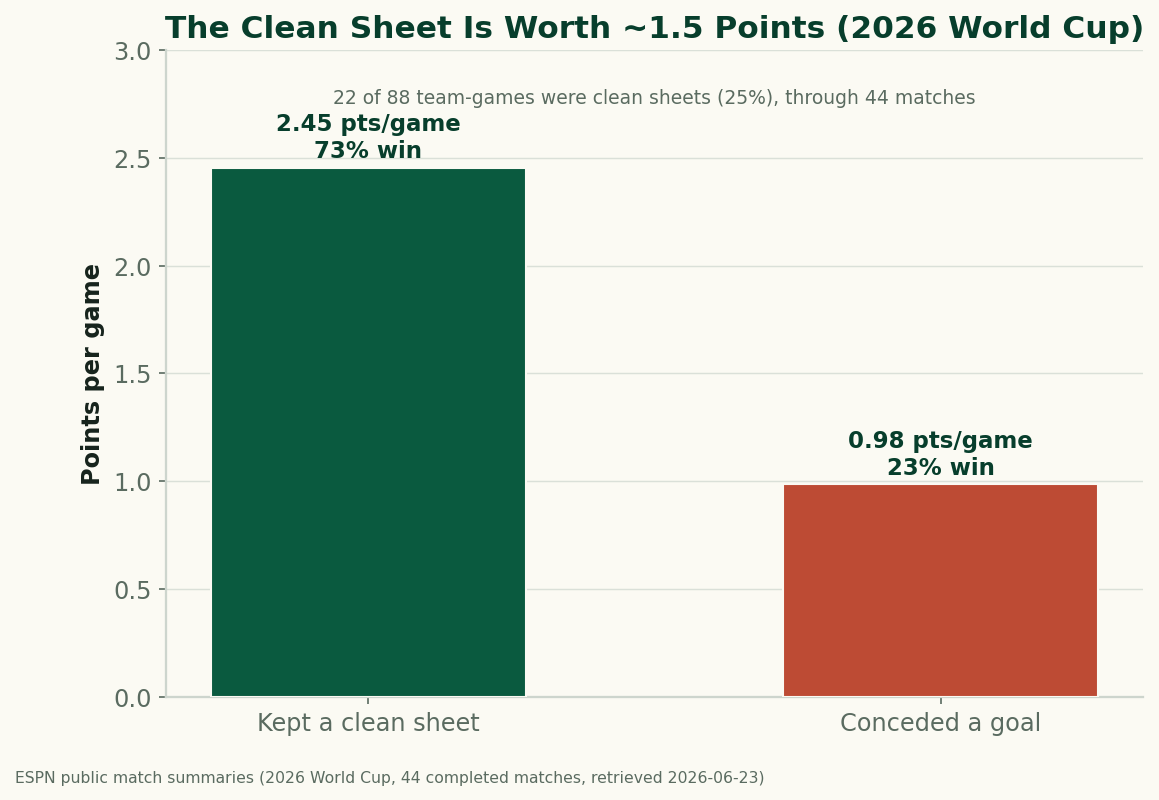
The Clean Sheet Is the Most Valuable Thing at the 2026 World Cup
Through 44 completed matches, a team that keeps a clean sheet at the 2026 World Cup averages 2.45 points and wins 73% of the time; a team that concedes averages under 1. Don't concede and you almost can't lose — the data on what a clean sheet is worth.