Matchweek Two: One Heist Refunded, One Doubled Down, and the Ball Keeps Losing
Matchweek one ended with two smash-and-grabs and a warning about conversion rates. Matchweek two answered one heist with a 5-2, watched the other repeat itself, and kept handing wins to the side with less of the ball. Nineteen box scores in, the season has a personality.
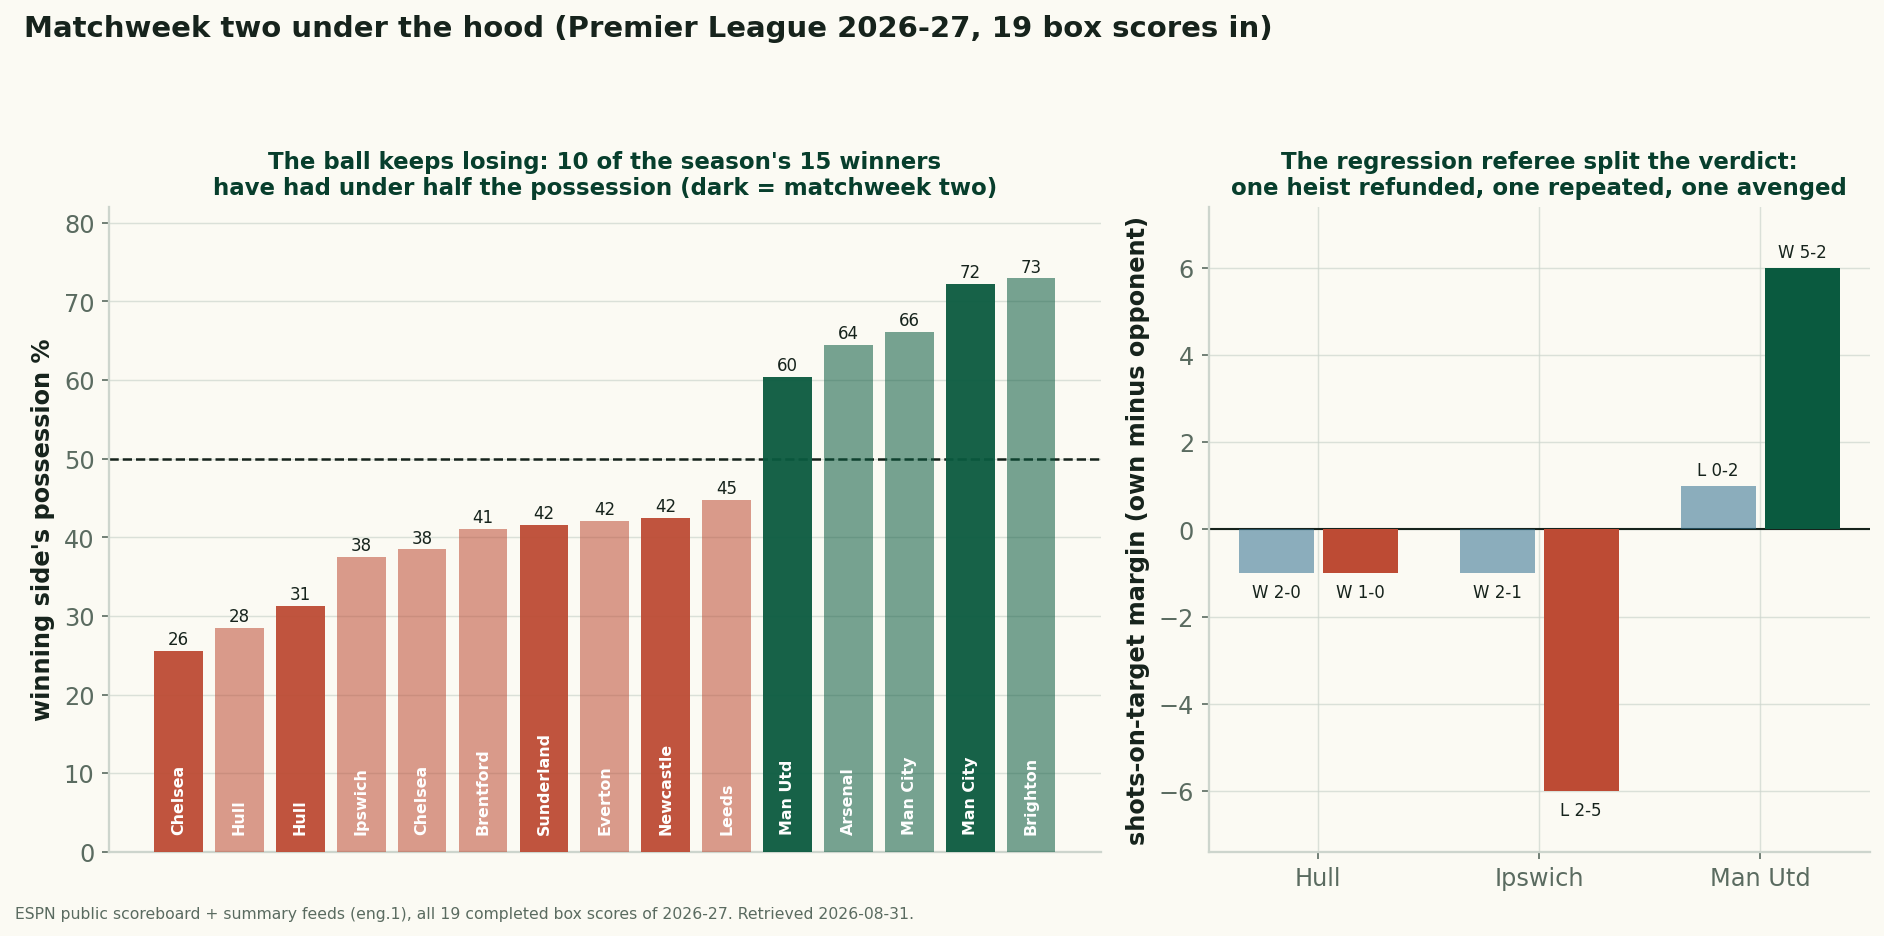
A week ago we filed Hull 2-0 Manchester United and Ipswich 2-1 Sunderland as the weekend's two authentic heists — wins taken against the run of the box score — and left the obvious question hanging: what does regression do with results like that? Matchweek two answered it both ways at once. Ipswich paid their heist back in full, beaten 5-2 at Old Trafford by a United side that put up the season's biggest shot count. Hull pulled the same robbery twice, winning 1-0 at Coventry with 31.3% of the ball and fewer shots on target than the side they beat. And underneath the individual verdicts, the season's strangest habit got stronger, not weaker: ten of the fifteen match winners so far have had less than half the possession. Two weekends in, the ball keeps losing.
Sourcing. Every number below comes from ESPN's public scoreboard and summary feeds for eng.1 — all 19 completed matches of 2026-27, with per-team box-score stats, retrieved 2026-08-31 by data_layer/refresh_epl.py and recomputed by charts/chart_epl_mw2_2026_regression.py, which re-checks every figure in this piece (71 checks) each time the site builds. Nine of matchweek two's ten fixtures were complete at retrieval; Arsenal against Aston Villa was still to play, so this piece reads the nine that exist. Baselines come from the complete 380-match 2025-26 dataset. Nineteen games is still a tiny sample, and the season-long version of every ledger here runs automatically on the live 2026-27 tracker.
The ledger's worst weekend yet
First, the running test. The shots-on-target rule — the side that matches or beats its opponent on target wins the game — called 70 of 80 decided matches at the World Cup and 7 of 9 in matchweek one. Matchweek two was its roughest outing so far: 4 of 6. Manchester City (a 4-1 at Palace with a 9-1 on-target count), Sunderland and United won with the ledger; Chelsea's 4-3 over Brighton was level at six apiece; and two winners were out-targeted outright. One was Hull, again. The other was Newcastle, who won 2-0 at Tottenham while being out-shot 11-17 and out-targeted 2-6 — on the raw counts, the most lopsided defeat-defying win of the season so far, and Spurs' second straight loss in a game they didn't lose on chances created.
Across the season that leaves the rule at 11 of 15 decided games — 73% — against 88% across a World Cup. Four violations in fifteen games is a faster leak than tournament football managed, and it would be convenient to announce that the club game simply runs colder on this signal. Fifteen games cannot carry that claim. What they can carry is the pattern inside the violations: all four belong to just three clubs, and two of the four belong to one of them.
One heist refunded, one doubled down
The cleanest regression story of the weekend happened at Old Trafford. United's matchweek-one defeat at Hull came with 71.5% possession, 21 attempts and a won on-target count — the box score voted "bad finishing day", the scoreline voted "crisis". Sunday was the box score's rebuttal: 33 shots and 11 on target — both season highs — 60.4% of the ball, and a 5-2 win over Ipswich, the other team that had opened the season by winning from behind on chances. One result does not repair a September; United still conceded twice, and the club that finished third on 71 points last season is now 1-1 against sides promoted since. But if you believed the underlying numbers at the MKM Stadium, Old Trafford is what being right looks like.
Hull are the harder case, and the more interesting one. At Coventry they had 31.3% possession, six shots to eleven, two on target to three — and won 1-0. That is now two wins from two, both taken while out-targeted by one, on a two-game total of 14 shots and 6 on target. Hull own two of the season's four rule violations by themselves, and their wins have come with 28.5% and 31.3% of the ball. Nothing in those numbers says sustainable; teams do not generally bank points at one goal per seven shots all year. But the points are banked, and they are real: the three clubs who weren't in last season's dataset at all — Hull, Ipswich and Coventry — are a combined 3-0-3, nine points, and Hull hold six of them. Last season's data can't price these teams. So far, the market inside the box scores can't either.
The ball keeps losing
Matchweek one's loudest fact was that six of nine winners had under half the ball. The natural expectation was a drift back toward normal. Instead matchweek two produced four more sub-50% winners in six decided games, and the season's ledger now reads 10 of 15, with the average winner holding 47.3% possession. The new entries are not subtle cases. Chelsea beat Brighton 4-3 at home with 25.6% of the ball — the lowest winning possession share of the season, in one of the weekend's two seven-goal games — and have now won both their matches from 38.5% and 25.6%. Sunderland beat Fulham 1-0 from 41.6% while holding their visitors to zero shots on target from eleven attempts, the second time in two weekends a team has finished a Premier League match without testing the keeper once (Aston Villa did it in matchweek one, from six attempts). Newcastle's win at Spurs came from 42.5%.
The reconciliation we offered last week still holds, and two more rounds of evidence have not bent it: possession is a style measurement, not a threat measurement. What has changed is the scale. One weekend of possession losing was a curiosity. Two is a habit, and the sorted chart above is starting to look like a thesis about how this league's mid-table intends to win football matches: concede the ball, defend the box, and cash three or four of the chances that come back the other way.
The best numbers in the league have two points
The draws tell the same story from the other side. Liverpool followed their 27-shot 2-2 at Newcastle with a 2-2 at home to Forest, and their season line is now a small monument to the gap between process and points: 40 shots to 25, 11 on target to 7, 65.2% average possession — two points. Brentford joined the same file on Sunday, out-shooting Leeds 22-12 and out-targeting them 5-2 for a 1-1. Neither line is a grievance; draws are what the ledger calls no-decisions, and both clubs created enough to win without doing so. But when the flagship table starts meaning something in October, remember that the argument for patience was never about bad teams being secretly good — it was about fifteen-game verdicts being built on samples exactly like these.
And the scoring environment refuses to cool. Matchweek one ran at 3.00 goals per game on 34.1% on-target conversion, and we wrote that mid-thirties conversion does not survive contact with a season. Matchweek two's reply: 31 goals in nine games — 3.44 per game — on 38.3% conversion. The season now sits at 3.21 goals per game and 36.1% conversion, against 2.75 goals per game across all of last season. Home advantage, meanwhile, came back to earth on schedule: after matchweek one's 7-1-2, the second round split 3-3-3, and the season's 10-4-5 (52.6% home wins against last year's 42.6%) is drifting toward the baseline the way opening-weekend noise usually does. We expect the conversion rate to follow it down. It just hasn't started yet, and the tracker will show the week it does.
What two weekends are, and aren't
The honest caveats, updated. Nineteen games. Every rate in this piece would move visibly with one more round; 73% on the ledger and 47.3% average winning possession are readings, not laws. One fixture short. Arsenal v Villa hadn't kicked off when we pulled the data on 31 August; matchweek two's numbers here are nine-tenths of the round, and we've dated every claim accordingly. One provider. Possession, attempts and on-target counts come from a single public feed, and providers disagree at the margins; treat the scores as certain and the box-score decimals as one shop's measurement. The lens is still blunt. Shots on target grades a scuffed roller and a top-corner volley identically; without shot locations or an xG model for this dataset, we read volume and accuracy, not chance quality — which is precisely how a team like Hull can stay unpriced for another week.
Reproduce it. The dataset is served at /data/epl_2026_27_results.json — completed matches only, per-team stats included, refreshed before every build by data_layer/refresh_epl.py. The chart and all 71 published figures are recomputed offline from that snapshot by charts/chart_epl_mw2_2026_regression.py, which fails the build if any number in this piece stops reproducing. The season-long matched-or-beat ledger and the cooling watch both run automatically on the living season page.
Sources & further reading
- 2026-27 results and box scores: ESPN’s public scoreboard and summary feeds for eng.1, completed matches only, retrieved 2026-08-31 by
data_layer/refresh_epl.pyand served at/data/epl_2026_27_results.json. - 2025-26 baselines (all 380 matches, including the final table and last season’s 2.75 goals per game):
data_layer/epl_2025_26_results.json, pulled bybuild_epl_2025_results.py. - Matchweek one’s ledger and the two original heists: Matchweek One Under the Hood.
- The cross-competition version of the rule: the 2026 World Cup, 70 of 80 decided games.
- Reproduction:
charts/chart_epl_mw2_2026_regression.py, which recomputes and re-checks all 71 published figures each build.
Published by SoccerAnalytics from public data and the sources named in this piece. How this site is made.