Schedule Strength Is Real. It Still Won't Fix the Table
Every August the same defence gets made for a club with no points: look who they have played. This time we priced it. The fixture asterisk after two rounds is real, large, measurable, and — on last season's replay — worth nothing at all.
The Premier League's third round opens tonight at Portman Road, and it opens on a table in which Aston Villa — fourth last season, sixty-five points — have none, and Hull City, who were not in this division in May, have six. The defence writes itself: look who they have played. It is a fair defence and it can be priced. Villa drew the hardest opening pair in the league by opponent quality — away at Brighton, home to Arsenal, two clubs that averaged 69.0 points last season against a league mean of 51.8; across the fifteen clubs whose two opponents both played in the Premier League in 2025-26, the correlation between opponent quality and points won is −0.48. Roughly a quarter of the current table is the fixture computer talking. And then the part nobody puts in the defence: correcting for it changes nothing. Re-rank those fifteen clubs by points above a difficulty-adjusted par and nine of them do not move at all. Replay all of last season and a two-game table — adjusted or raw — predicts May worse than assuming every club is average.
Sourcing. Two datasets, no models. The current season is ESPN's public scoreboard and summary feeds for eng.1, completed matches only — the 20 games played between 21 and 31 August 2026, matchweeks one and two, pulled by data_layer/refresh_epl.py and served at /data/epl_2026_27_results.json. That snapshot is re-pulled before every build and holds 59 completed matches as of 12 October 2026; this piece filters it to the August window and uses nothing else, so the arithmetic below reproduces from whatever the file currently holds. Every baseline, tier and par rate comes from the complete 380-match 2025-26 season in data_layer/epl_2025_26_results.json. Both files are published here, at those exact paths. All 163 figures below are recomputed offline from them by charts/chart_epl_fixture_asterisk.py, which redraws the chart on this page and exits non-zero if any published figure stops reproducing — and because the inputs are served, you can redo the arithmetic without taking our word for it. Matchweek three had not kicked off when this was written. It has since been played, and it sits outside the window by construction, so it moves none of the figures here.
Who you play matters more than where you play
Start by establishing that the asterisk is not imaginary, because it very much is not. Split last season's 760 club-games by the opponent's finishing position — top six, middle eight, bottom six — and the returns are these: 0.904 points per game against the top six, 1.385 against the middle, 1.794 against the bottom six. That is a spread of 0.890 points per game purely from the identity of the other team. For comparison, the same 380 matches give the home side 1.553 points per game and the away side 1.174, a home edge of 0.379 — and 1.55 is the same number our home-advantage piece found across 3,425 StatsBomb domestic matches, which is a reassuring sign the feed is not lying to us. Opponent quality is worth 2.35 times what venue is worth. The thing everyone adjusts for is the smaller of the two effects.
Cross the two axes and you get last season's par table: the average points a Premier League club took from each kind of fixture.
| vs top six | vs middle eight | vs bottom six | |
|---|---|---|---|
| At home | 1.132 (n=114) | 1.645 (n=152) | 1.851 (n=114) |
| Away | 0.675 (n=114) | 1.125 (n=152) | 1.737 (n=114) |
Read the corners. A club handed two home games against bottom-six opposition is playing for a par of 3.70 points; a club sent to two top-six grounds is playing for 1.35. The fixture list alone can allocate 2.35 of the six points on the table before anyone kicks anything. That is the asterisk, and it is enormous.
The 2026-27 asterisk, priced
Now point it at the current season. For each club, take the average of its two opponents' 2025-26 points totals. The band runs from Brentford at 44.0 — Tottenham at home, Leeds away, seventeenth and fourteenth from last season — up to Aston Villa at 69.0. Twenty-five points of last season's quality separates the softest start from the hardest, which is exactly the gap between last season’s champions and its fifth-placed side. And the correlation between that number and points won is −0.483: about 23% of the variance in the current table is explained by nothing more than the draw.
Five clubs cannot be priced this way at all, and we are not going to invent numbers for them. Arsenal, Hull, Sunderland, Coventry and Manchester United each played at least one of the three promoted sides — Coventry, Hull and Ipswich — who have no 2025-26 Premier League points to average. Last week's piece made the same admission about Hull: last season's data cannot price a team that was not in last season. What can be said out loud is that Manchester United drew both promoted sides in their first two fixtures — away at Hull, home to Ipswich — which is, on any convention you like, the softest opening pair in the division. Price promoted clubs as bottom-six sides, an assumption rather than a measurement, and United's par comes to 3.59 points. They took three of them, all from one 5-2 over Ipswich, after losing 2-0 at the MKM Stadium. The asterisk cuts in both directions and it is rarely quoted in this one.
Worked: Aston Villa's nought
Villa are the cleanest case in the league for the defence, so here it is end to end. Their two fixtures: away at Brighton & Hove Albion, who finished eighth on 53 points — a middle-eight side, so par 1.125 — and home to Arsenal, champions on 85, a top-six side at home, par 1.132. Add them: Villa's par for the opening fortnight was 2.257 points, the joint-lowest in the league among the fifteen priceable clubs. They took 0. Points above par: −2.257, the joint-worst figure in the division alongside Crystal Palace, who drew Everton away and Manchester City at home.
So the defence survives contact with arithmetic: Villa's start was genuinely brutal, and the naive table punishes them for it. Here is the problem. The adjustment leaves Villa twelfth of fifteen, exactly where the raw points left them. It moves them nowhere, because everyone around them drew hard fixtures too and 2.26 points of par is not enough to lift a club off zero. And a club that finished fourth last season is not really in doubt after two matches anyway — which is precisely the point, and it has a receipt: in 2025-26 Villa opened with a goalless draw at home to Newcastle and a 1-0 defeat at Brentford. One point from two games, and they finished fourth on 65. You did not need a fixture correction to know that. You needed to wait.
The correction that re-ranks nobody
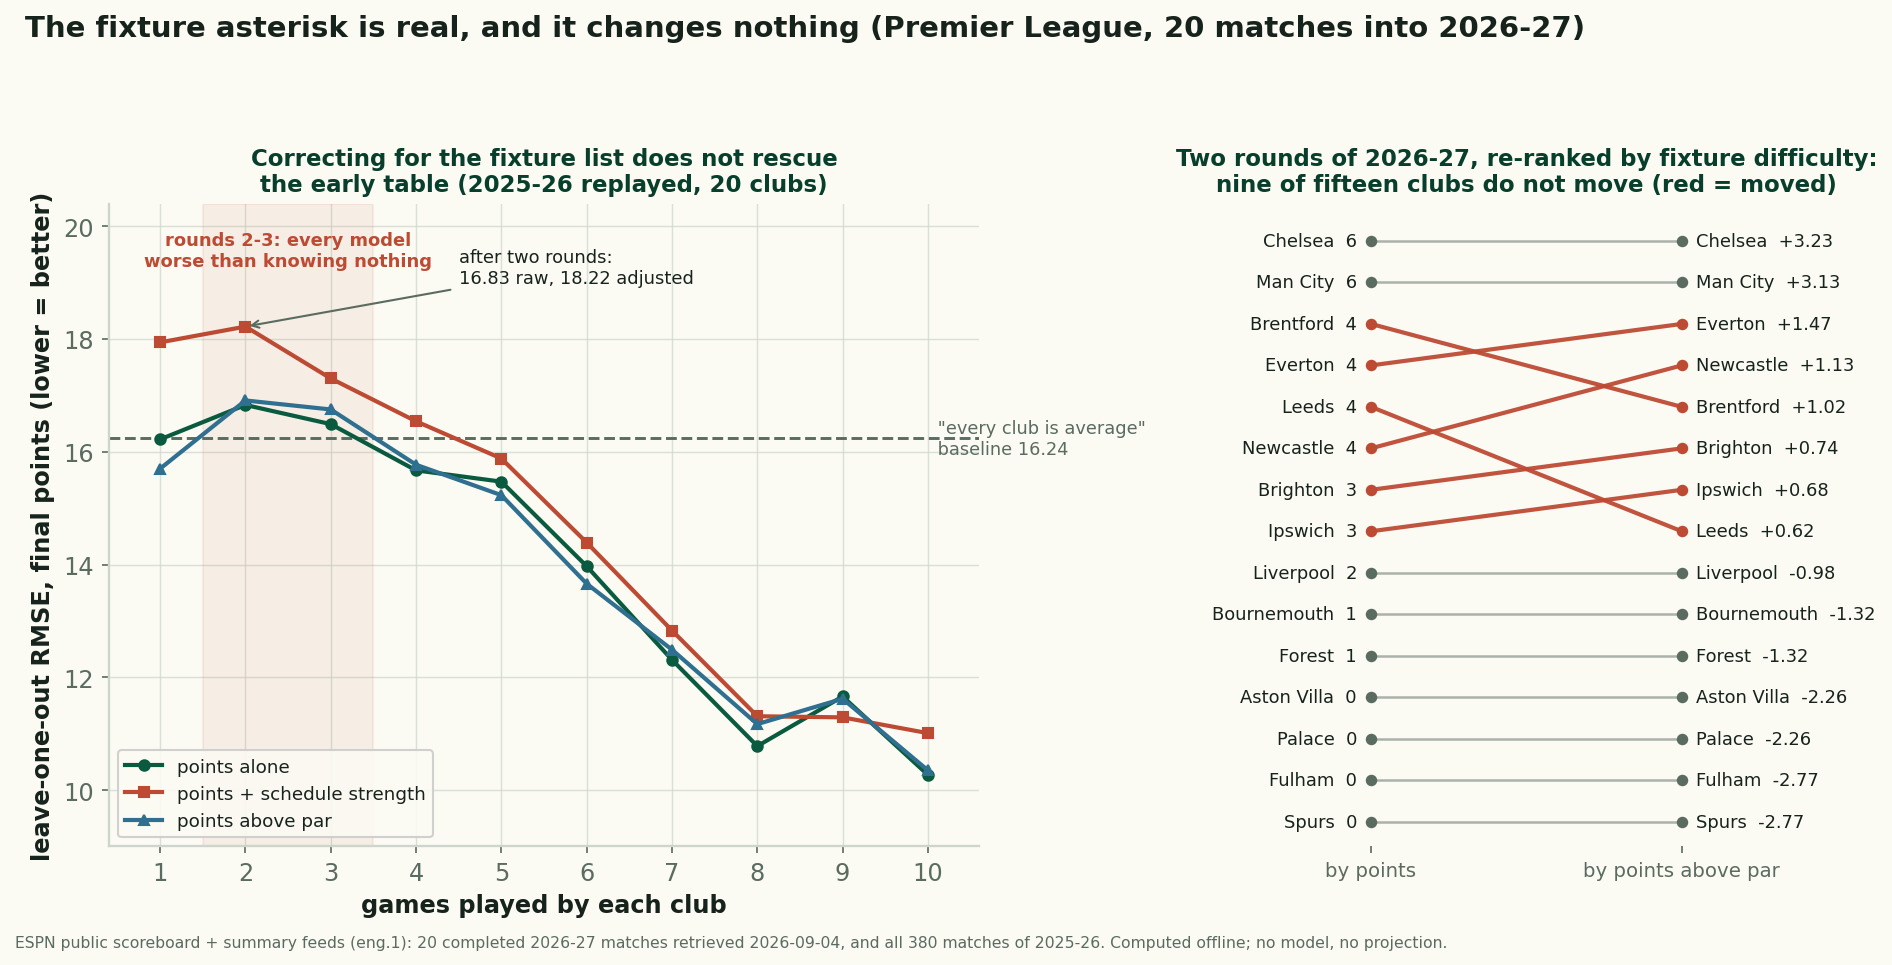
Rank the fifteen priceable clubs by raw points, then by points above par, and compare the two orders. Nine of fifteen do not move. The average club moves 0.67 places. The largest move in the league is three. The rank correlation between the two tables is 0.960. Chelsea and Manchester City are first and second either way; Villa, Palace, Fulham and Spurs occupy the bottom four either way. The right-hand panel above is what a correction looks like when it has almost nothing to correct.
The six clubs that do move are worth naming, because they are the entire yield of the exercise. Leeds United fall furthest — fifth on points, eighth on par — because their four points came off a par of 3.382, the softest fully-priceable draw in the league (Forest away, Brentford at home). Brentford drop two without having done anything wrong: their par was a middling 2.976, and two clubs simply cleared harder bars. Everton and Newcastle rise on the strength of having faced Bournemouth and Liverpool respectively; Brighton and Ipswich gain a place each. Six small shuffles in a fifteen-club table, at the moment in the season when fixture luck is at its absolute maximum. If the correction cannot re-order the table now, it never will.
Worse than knowing nothing
The re-ranking test says the correction does not change the table. The harder question is whether it makes the table more informative — whether an adjusted early table predicts May better than a raw one. For that we replayed 2025-26 in each club's own order and asked, after each club's first k games, how well three quantities predicted its final points total: points alone, points plus schedule strength, and points above par. Every model is scored by leave-one-out cross-validation, so each club's prediction comes from a fit that never saw that club, and the benchmark is the flat, contemptuous alternative of predicting the league average for everybody.
The benchmark's error is 16.24 points. After two rounds, points alone score 16.83; points plus schedule strength score 18.22; points above par score 16.91. All three are worse than the flat guess. After two games the Premier League table is not merely uninformative, it is actively misleading, and adjusting it for fixture difficulty makes it more misleading still. Three games in is no better: 16.49, 17.30 and 16.75, all above the line. The first round at which points alone beat the baseline by anything you could see is game four (15.67), and the first genuinely useful reading arrives around game eight (10.78, a third better than the flat guess). The two adjusted models never take a durable lead over the raw one; across ten rounds the schedule-strength model wins exactly once, at game nine, by 0.37.
None of these gaps are individually significant — twenty clubs is twenty data points, and the standard error on a correlation at that sample size is about 0.21 — and we want to be careful about what is claimed. The claim is not that adjusting for schedule strength hurts. The claim is that after this many games there is nothing there to help: the signal you recover by removing the fixture list is smaller than the noise you were left with, and the correction burns a degree of freedom to buy it. That is the honest shape of a null.
Three clubs that would have fooled the correction
The null has a texture, and last season's openers show it. Tottenham began 2025-26 with a 3-0 over Burnley and a 2-0 win at the Etihad — six points from two, including a trip to the eventual runners-up, so a fixture-difficulty correction would have marked them up. They finished seventeenth on 41. Manchester City took three points from the joint-softest opening pair in the league (their two opponents averaged 30.5 points, tied with Sunderland’s), so the correction marks them down; they finished second on 78. Manchester United took one point from a hard pair — home to Arsenal, away at Fulham — and the correction marks them up; they finished third on 71. One in three. That is what a coin looks like when you insist it is a compass.
This is the reconciliation with the piece we ran on opening night, which measured how long the table itself takes to agree with May and found the honest answer was late October. That result and this one are the same result from two directions: the table is noise for two months, and the most popular fix for that noise does not fix it. The obvious remaining move — grade the performances rather than the results — is what the matchweek box-score pieces have been doing all along, and it is a different and better-founded argument than a fixture asterisk.
What breaks this
One season, twenty clubs. The replay rests on a single Premier League season; 2025-26 could be unrepresentative and n=20 is a small enough sample that every number in the last two sections carries visible error bars. The pattern we would defend across seasons is the ordering — adjustment does not rescue a two-game table — not the decimals.
The correction is given every advantage. Opponent strength here is each opponent's final 2025-26 points total, which is hindsight nobody had in August. A real-time correction would use preseason ratings and would be noisier still. The adjustment fails while holding a marked deck.
Two adjustment methods, one conclusion. Mean opponent points and the venue-by-tier par table are different instruments — they correlate at −0.82 across the fifteen clubs, not −1.0 — and they disagree on details. They agree on the finding, which is the only reason we trust it.
The correction eats itself late in a season. Schedule strength is only a meaningful variable while the schedule is unequal. After nineteen games each club has faced eighteen distinct opponents, so “who you have played” converges on “everybody except yourself” — and a good side's opponent pool is mechanically weaker than a bad side's, because it excludes the good side. Residualising on schedule strength at that point strips out real quality: at game eighteen the adjustment costs 0.379 of correlation with the final table. Anyone quoting a strength-of-schedule number in March is quoting an artifact.
Three clubs are unpriceable and one convention is doing work. Coventry, Hull and Ipswich have no 2025-26 Premier League record, so five clubs sit outside the main exhibit entirely, and the only number that prices them — Manchester United's 3.59 par — assumes promoted sides play like bottom-six sides. That assumption is stated, not measured, and Hull's six points from two are currently arguing against it.
Results only. The 2025-26 file carries scores, not box scores, so tiers here are built from points, not from performance. A version of this piece with shot data on both seasons could ask whether an underlying-numbers correction works where a results correction fails — and the projection-model piece explains why serious models do exactly that instead of adjusting a points table. The 2026-27 feed does carry box scores, so that test becomes possible on this season around Christmas.
Reproduce it
Both datasets are served on this site, so nothing here rests on trust. The current season is at /data/epl_2026_27_results.json (completed matches only, per-team box scores included, refreshed from ESPN before each build); the 2025-26 season is at /data_layer/epl_2025_26_results.json, all 380 matches. The recipe, in order: build last season's final table from those 380 results; sort the twenty clubs into three tiers (top six, middle eight, bottom six); for each of the six tier-by-venue cells, average the points won per club-game to get the par rate; score each 2026-27 club's fixtures so far against the par rate for the venue and tier of each opponent it has actually faced; subtract. The leave-one-out replay refits the same ordinary-least-squares regression twenty times, dropping one club each time, and the regression itself is twelve lines of arithmetic — no library to disagree with. That script recomputes all 163 published figures on every run and fails loudly if any of them drifts.
The running version of the table this piece is arguing about updates itself on the 2026-27 tracker. Our advice for the next six weeks is the same as it was on opening night, only now with the escape hatch closed: the table is noise, and the fixture list is not the reason it is noise. Come back at game eight.
Sources & further reading
- 2026-27 results and box scores: ESPN’s public scoreboard and summary feeds for eng.1, completed matches only, pulled by
data_layer/refresh_epl.pyand served at/data/epl_2026_27_results.json(59 completed matches as of 2026-10-12; this piece reads the 2026-08-21 to 2026-08-31 window of it). - 2025-26 baselines — the final table, the opponent tiers and every par rate:
data_layer/epl_2025_26_results.json, all 380 matches, pulled from the same ESPN feed on 2026-08-21. - How long the table itself takes to tell the truth: The Table Lies Until October.
- The venue half of the effect, on an independent dataset: Home Advantage, Quantified.
- The performance-based alternative to adjusting a points table: Matchweek One Under the Hood and Matchweek Two.
- Why real projection models adjust ratings rather than tables: Why League Projection Models Disagree; the same limitation, named and left unquantified at a World Cup, in the backtested prediction model.
- Reproduction: the two datasets above plus the recipe in “Reproduce it” — 163 published figures, all recomputing from those files as of 2026-09-05.
Published by SoccerAnalytics from public data and the sources named in this piece. How this site is made.