Three Games Tell You How a Team Plays, Not How Good It Is
The fixture list has paused the Premier League at three games a club, and every number in the box score is being read as a verdict. We replayed last season a thousand times to find out which of those numbers has already settled. The answer sorts the box score into two piles, and the table is in the wrong one.
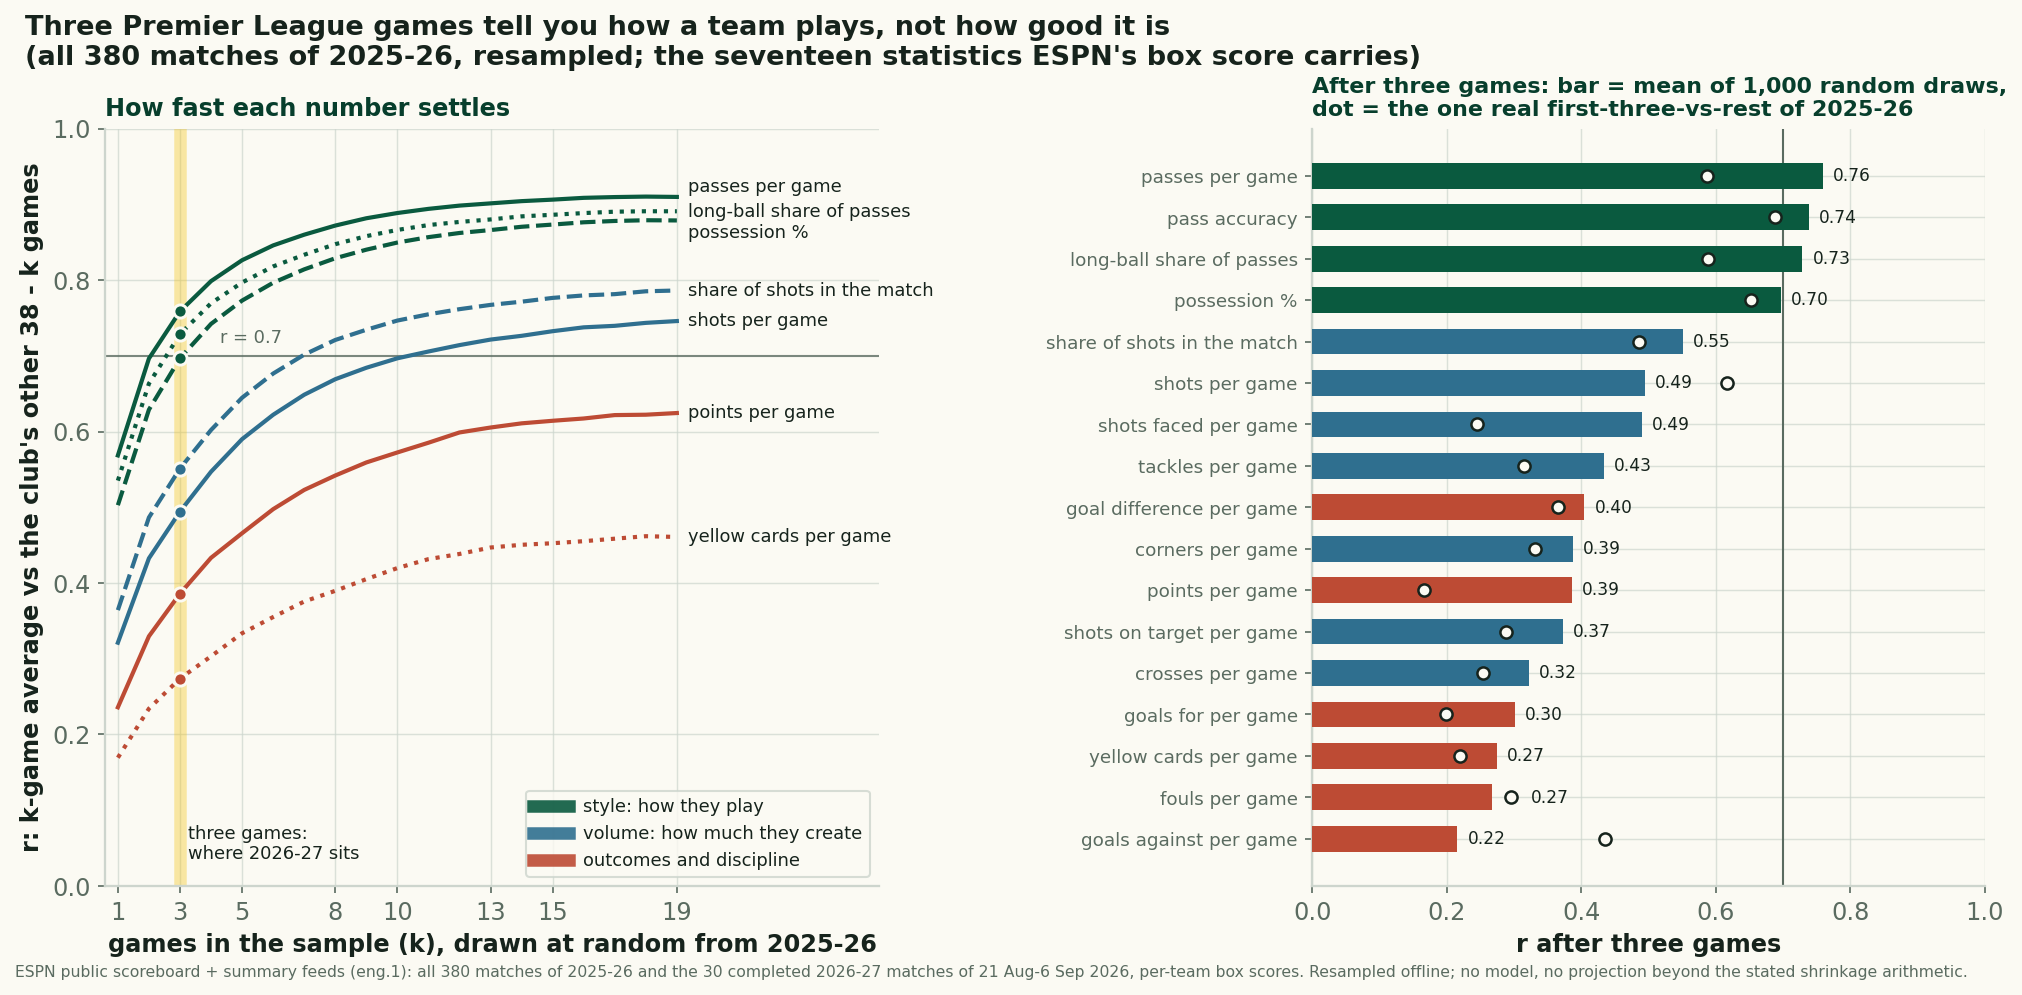
Every Premier League club has played exactly three matches, and the pause has given the numbers time to harden into opinions. Some of them deserve it. After three games, a club's passes per game already agrees with the rest of its own season at a correlation of 0.76; pass accuracy is at 0.74, long-ball share at 0.73, possession at 0.70. Those are the numbers that describe how a team plays, and they are close to settled. The numbers that describe how good a team is are not: points per game after three matches correlate with the rest of the season at 0.39, goals scored at 0.30, goals conceded at 0.22, and yellow cards at 0.27. Shots sit in between, at 0.49. That ordering is the whole finding, and it is not an opinion — it is what all 380 matches of 2025-26 say when you cut them into three-game pieces a thousand different ways.
Sourcing. Two datasets, no models. The laboratory is last season: all 380 matches of 2025-26 with ESPN's per-team box scores, pulled by data_layer/build_epl_2025_boxscores.py and served at data_layer/epl_2025_26_boxscores.json — 380 of 380 summaries, none missing, every scoreline cross-checked against the results file this site has published since August. The live season is ESPN's public scoreboard and summary feeds for eng.1, completed matches only, pulled by data_layer/refresh_epl.py before every build and served at /data/epl_2026_27_results.json; it holds 50 completed matches as of 25 September 2026, and this piece filters it to the 21 August to 6 September window — the 30 matches of matchweeks one to three, every club three games — so later rounds cannot walk into the figures. All 163 numbers below are recomputed offline from those two files by charts/chart_epl_stat_reliability.py, which redraws the chart on this page and exits non-zero if any published figure stops reproducing.
The measurement
The question "is this number real yet" has a precise form: if we measured a club on three games and then on the rest of its season, how well would the two readings agree? A single season gives one such comparison per statistic, and one comparison on twenty clubs carries a standard error of about 0.2, which is useless. So instead of using the actual first three games of 2025-26, we drew three games at random for every club, averaged each statistic over those three, averaged it over the remaining 35, and correlated the two across the twenty clubs. Then we did it again with a different draw, a thousand times, and averaged the correlations. Then we did the same for every sample size from one game to nineteen. The result, for each statistic, is a curve: how much a k-game reading of a club agrees with the rest of that club's season. It is the reliability of a k-game sample, measured rather than assumed, on the same clubs under the same rules, with no cross-season change to muddy it.
Seventeen statistics come out of ESPN's per-team box score, and we ran all of them. Four describe style: passes per game, pass accuracy, the share of passes that were long balls, and possession. Seven describe volume: shots, shots faced, the club's share of all shots in its matches, shots on target, corners, crosses and tackles. Six are outcomes and discipline: goals for, goals against, goal difference, points, fouls and yellow cards. The curves split into exactly those groups without being told to.
Style settles first, and fast
After one game, a club's passes per game already correlates 0.57 with the other 37 games of its season, and its possession 0.50. After three games those are 0.76 and 0.70. Pass accuracy and long-ball share are in the same band, at 0.74 and 0.73. Pick 0.7 as the line at which a number is worth quoting, and passes cross it at about 2.1 games, pass accuracy at 2.4, long-ball share at 2.6 and possession at 3.1 — which is to say, possession is a tenth of a game short of the line right now, and will be over it the moment the fourth round is played. By ten games these four sit between 0.85 and 0.89; by half a season, between 0.88 and 0.91. Apply the Spearman-Brown correction to that half-versus-half figure and a full season of passing volume measures a club at a reliability of about 0.95. There is very little noise in how a team plays.
Volume settles slower. The share of all shots in a club's matches that were its own — the cleanest box-score proxy for which side was better — is at 0.55 after three games and needs 6.9 games to reach 0.7. Raw shots per game needs 10.4, shots faced 12.0. Corners, shots on target, crosses and tackles never reach 0.7 inside half a season at all, and shots on target sit at 0.37 after three games, which is worth remembering the next time a club's on-target count is quoted as evidence of anything.
Outcomes never get there
Now the pile the table is in. Points per game after three matches correlate 0.39 with the rest of the season. Goal difference is 0.40, goals scored 0.30, goals conceded 0.22. Not one outcome statistic reaches 0.7 by nineteen games: points top out at 0.62 at the half-season split, goals for at 0.52, goals against at 0.39. Points need 6.1 games just to reach 0.5, the level passes per game clears on day one. The full-season reliability of a points-per-game figure, by the same Spearman-Brown arithmetic, is about 0.77 — a 38-game league table is a decent measurement of a club's quality. A three-game one is not, and the shrinkage arithmetic below says how much of it to keep.
Discipline is the noisiest thing in the box score. Yellow cards per game correlate 0.27 after three games and only 0.46 after nineteen; fouls are 0.27 and 0.47. Neither reaches 0.5 inside half a season. Monday's piece found that a club's three-game booking rate carried no information about the rest of its season, on one chronological cut. This is the same result on a thousand cuts, and it says the problem is not three games. It is that cards barely describe a club at all.
| Statistic | r after three games | Games to reach 0.7 |
|---|---|---|
| Passes per game | 0.76 | 2.1 |
| Pass accuracy | 0.74 | 2.4 |
| Long-ball share of passes | 0.73 | 2.6 |
| Possession | 0.70 | 3.1 |
| Share of shots in the match | 0.55 | 6.9 |
| Shots per game | 0.49 | 10.4 |
| Shots faced per game | 0.49 | 12.0 |
| Tackles per game | 0.43 | never |
| Goal difference per game | 0.40 | never |
| Corners per game | 0.39 | never |
| Points per game | 0.39 | never |
| Shots on target per game | 0.37 | never |
| Crosses per game | 0.32 | never |
| Goals for per game | 0.30 | never |
| Yellow cards per game | 0.27 | never |
| Fouls per game | 0.27 | never |
| Goals against per game | 0.22 | never |
The one real draw
The averages above are a thousand hypothetical Augusts. Last season had one real one, and it is worth checking that the actual first three games of 2025-26 behaved like the average draw. Mostly they did: the real first-three-versus-rest correlation was 0.59 for passes, 0.65 for possession, 0.62 for shots, 0.17 for points and 0.22 for yellows. The ordering is the same. But the single draw wobbles by as much as 0.25 around the average — shots faced came in at 0.24 against an average of 0.49, goals against at 0.43 against 0.22 — and 14 of the 17 real figures landed below their thousand-draw average. We would not lean on that last number: the seventeen statistics share the same three games, so it is nearer one observation than seventeen. But it is consistent with the real August being slightly less informative than a random three games, which is what you would expect from a month of new signings, new managers and pre-season legs. The dots on the right of the chart are that one draw.
The clubs make the same point in plain English. After three games of 2025-26 the top possession side was Chelsea at 61.5%; they played the remaining 35 at 57.4% and finished the season at 57.7%. The bottom side was Crystal Palace at 37.4%, and they played the rest at 46.7%. Both regressed, and both stayed on their side of the league. Rank the twenty clubs by possession after three games and again at season's end and the average club moves 3.5 places; do the same for points and the average club moves 5.5. Three of the five highest-possession clubs after three games finished in the top five for possession. Two of the five highest-points clubs finished in the top five of the table. The only club with nine points from nine was Liverpool, who finished on 60. The only club with none was Wolves, who finished on 20, so a bad start was a truer signal than a good one that year — on a sample of one club each, which is exactly the kind of sentence this piece exists to discourage.
Worked: what to keep of Manchester City's 72%
The same thousand draws give a second number that is more useful than the correlation: the shrinkage slope. Regress a club's rest-of-season average on its three-game average, across the draws, and the slope says how much of a club's distance from the league mean survives. For possession after three games it is 0.528; for passes 0.612; for shot share 0.357; for shots 0.300; for points 0.203; for goals scored 0.138; for yellow cards 0.118.
Manchester City have had 72.0% of the ball across their three matches, the highest figure in the league, against a league mean that is 50.0% by construction. Their distance from the mean is 22.0 points; keep 52.8% of it and the best projection of their possession over the rest of the season, from these three games alone, is 50.0 + 0.528 × 22.0 = 61.6%. That would have been the highest full-season figure in the league last year, above City's own 60.5, and it is a claim we would defend: possession is the kind of number three games can nearly carry.
Now the same arithmetic on the table. Arsenal and City both have nine points from nine, 3.00 a game. Last season's league average was 1.363 a game. Arsenal's distance from the mean is 1.637; keep 20.3% of it and the projection is 1.363 + 0.203 × 1.637 = 1.70 points a game for the remaining 35, or 59.3 points, for a season total of about 68. The naive projection, 3.00 a game over 38, is 114. Neither is a prediction — the shrinkage uses nothing but this season's three games and the league mean, and anyone with a memory of last season's champions would start from a higher prior — but the gap between 68 and 114 is the honest size of what three games of results are worth. Four fifths of a perfect start is noise, on the average club.
What the settled numbers say about 2026-27
If style is the one thing three games can measure, then the useful thing to read this week is the style table, not the league table. On passes per game the league runs from Manchester City at 741.0 and Fulham at 617.3 to Leeds at 309.7 and Hull City at 248.0, against a league average of 439.6 that is almost exactly last season's 437.0. On possession it runs from City at 72.0% and Brighton at 71.4% to Chelsea at 36.5% and Hull at 28.8%. On the share of shots in their own matches, Manchester United lead at 0.649, a hair ahead of City at 0.648 and Brighton at 0.638, with Crystal Palace bottom at 0.342. Those readings will move, but the curves above say they will move within a few places, not from top to bottom.
Set that against the table. Fulham, second in the league for passing and fifth for possession, have no points; Hull, twentieth for both, have seven, third on their own. Chelsea have six points while seeing less of the ball than any club but Hull, having averaged 57.7% possession and 540 passes a game last season and 36.5% and 329 so far in this one. That is the largest change of style in the league by a distance, and it is a change we can measure without knowing its cause: the passes-per-game figure has moved by more than 20 a game for 13 of the 17 clubs that were in the division last year, with Brighton up from 54.1% to 71.4% of the ball and City up from 587.9 to 741.0 passes a game at the other end. The matchweek pieces have been calling this "the ball keeps losing", and the curves here explain why that is even visible: the ball is measurable after three games and the losing is not.
Across the 17 continuing clubs, this season's three-game figures correlate with last season's full-season figures at 0.62 for passes and 0.55 for possession, and at 0.59 for points. That last number is worth a moment. Three games of this season's results agree with last season's complete table better than, on the replay, three games agree with the rest of their own season. With seventeen clubs the standard error is about 0.2, so we will not build on the decimal; but the direction is the same one the opening-night replay and the fixture-difficulty piece both landed on. Last season's table is a better guide to this season than this season's table is, and will stay so for some weeks.
What this cannot tell you
- Reliable is not the same as important. Passes per game settle fastest and predict points poorly; the shot share settles slower and predicts them better. This piece measures how quickly a number describes a club, not how much that description is worth. The two questions are different and the projection models live in the gap between them.
- The benchmark is the rest of the season, not the truth. A 35-game average is itself an estimate, so every correlation here is a floor on the agreement with a club's true rate. The floor is lowest at nineteen games, where both halves are equally noisy, which is why the Spearman-Brown step is used there and nowhere else.
- Random games are not August games. The curves resample a whole season; the real opening three are played by squads that changed over the summer, against a fixture list that was not drawn at random. The single real draw sat a little below the average on 14 of 17 statistics. Treat the curves as the reliability of three typical games and this September as very slightly worse.
- Style is partly the opponent. Possession is zero-sum and passes are permitted by the other side, so a club's early style reading carries its opponents' style too. Three games against deep blocks will inflate anyone's passing. The possession-adjustment piece covers the standard correction, which needs event data this feed does not carry.
- One season, one provider. Everything here is 2025-26 through ESPN's box score. The ordering of the groups is the kind of result that survives a change of season; the second decimal of any curve is not. Fields like accurate passes, long balls, crosses and tackles exist only in the 2025-26 file, so they appear in the curves but get no 2026-27 ranking.
- Twenty clubs. Each correlation is over twenty points. Averaging a thousand draws removes the sampling noise of the draw, not the fact that there are only twenty Premier League clubs. Neighbouring statistics in the table above — corners and points at 0.39, fouls and yellows at 0.27 — are ties, not rankings.
Reproduce it
Both datasets are served here, so nothing rests on trust. Last season is at data_layer/epl_2025_26_boxscores.json, all 380 matches with per-team box scores; this season is at /data/epl_2026_27_results.json, completed matches only, refreshed before every build. The recipe: for each club build a 38-row table of per-game values for each statistic, with goals, goal difference and points from the scoreline, possession, passes and shots from the box score, pass accuracy as accurate over total passes, long-ball share as long balls over total passes, and shot share as the club's shots over both sides' shots in the match. Seed a random generator, and for each of a thousand draws permute each club's 38 games and, for every k from one to nineteen, correlate across the twenty clubs the mean of the first k permuted games with the mean of the rest. Average the correlations over the draws for the curve, and record the regression slope of the rest-of-season mean on the three-game mean for the shrinkage. Games-to-0.7 is a linear interpolation between the two integers the curve crosses. The chart script does all of it with a fixed seed, prints every figure quoted above, and fails if one of them changes.
The running version of the table this piece is asking you not to read is on the 2026-27 tracker, which updates itself. Our advice for the coming rounds: read the passing and possession columns as roughly true, read the shot columns as a lean, and read the points column as three coin flips that happened to land a certain way. The order in which those columns become real is the same in every season we can measure, which is one.
Sources & further reading
- 2025-26 box scores, every one of the 380 matches:
data_layer/epl_2025_26_boxscores.json, pulled from ESPN's public summary feed bybuild_epl_2025_boxscores.pyand cross-checked row-for-row againstdata_layer/epl_2025_26_results.json. - 2026-27 results and box scores: ESPN’s public scoreboard and summary feeds for eng.1, completed matches only, pulled by
data_layer/refresh_epl.pyand served at/data/epl_2026_27_results.json(50 completed matches as of 2026-09-25; this piece reads the 2026-08-21 to 2026-09-06 window of it). - The Spearman-Brown prophecy formula, used once to convert the half-season split into a full-season reliability: Spearman (1910) and Brown (1910), British Journal of Psychology, vol. 3. The step is 2r / (1 + r) applied to the nineteen-game correlation.
- The same question asked of the table alone, in chronological order: The Table Lies Until October.
- The same question asked of cards alone, on one cut: The Whistle Is Busier and the Cards Are Not.
- Why last season's table is the better prior, and why correcting the early table for fixtures does not help: Schedule Strength Is Real.
- What the three rounds looked like match by match: Matchweek One Under the Hood and Matchweek Two.
- Why the fast-settling numbers are not automatically the valuable ones: Why League Projection Models Disagree; and the correction for the opponent's share of the ball, Possession-Adjusted Stats.
- The tournament version of the same instinct, on three group games: Don't Overfit the Knockouts.
- Reproduction: the two datasets above plus the recipe in “Reproduce it” — 163 published figures, all recomputed by
charts/chart_epl_stat_reliability.pyat build time.
More from Data Deep-Dives
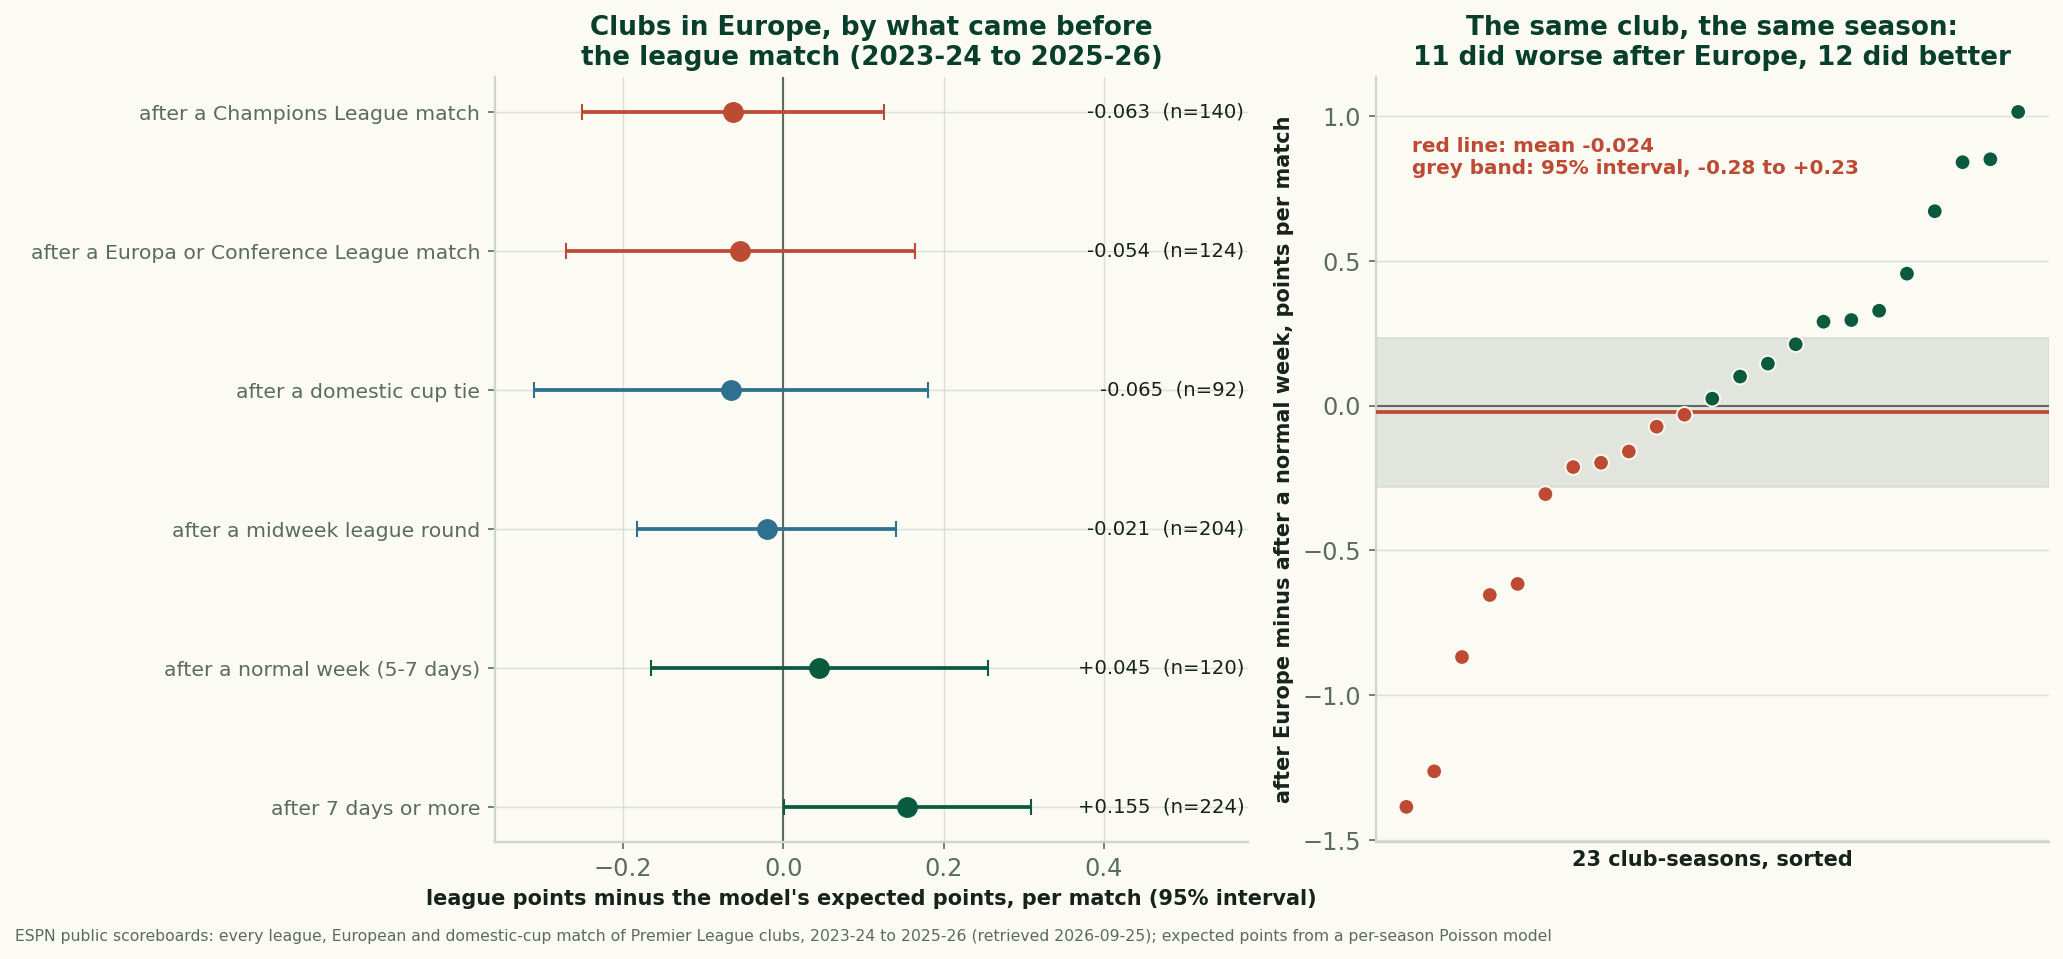
Does Europe Cost English Clubs at the Weekend? Three Seasons Can't Find It
After a European night, English clubs took 1.56 league points a match against 1.62 expected. Within the same club and season the gap is -0.024: not measurable.
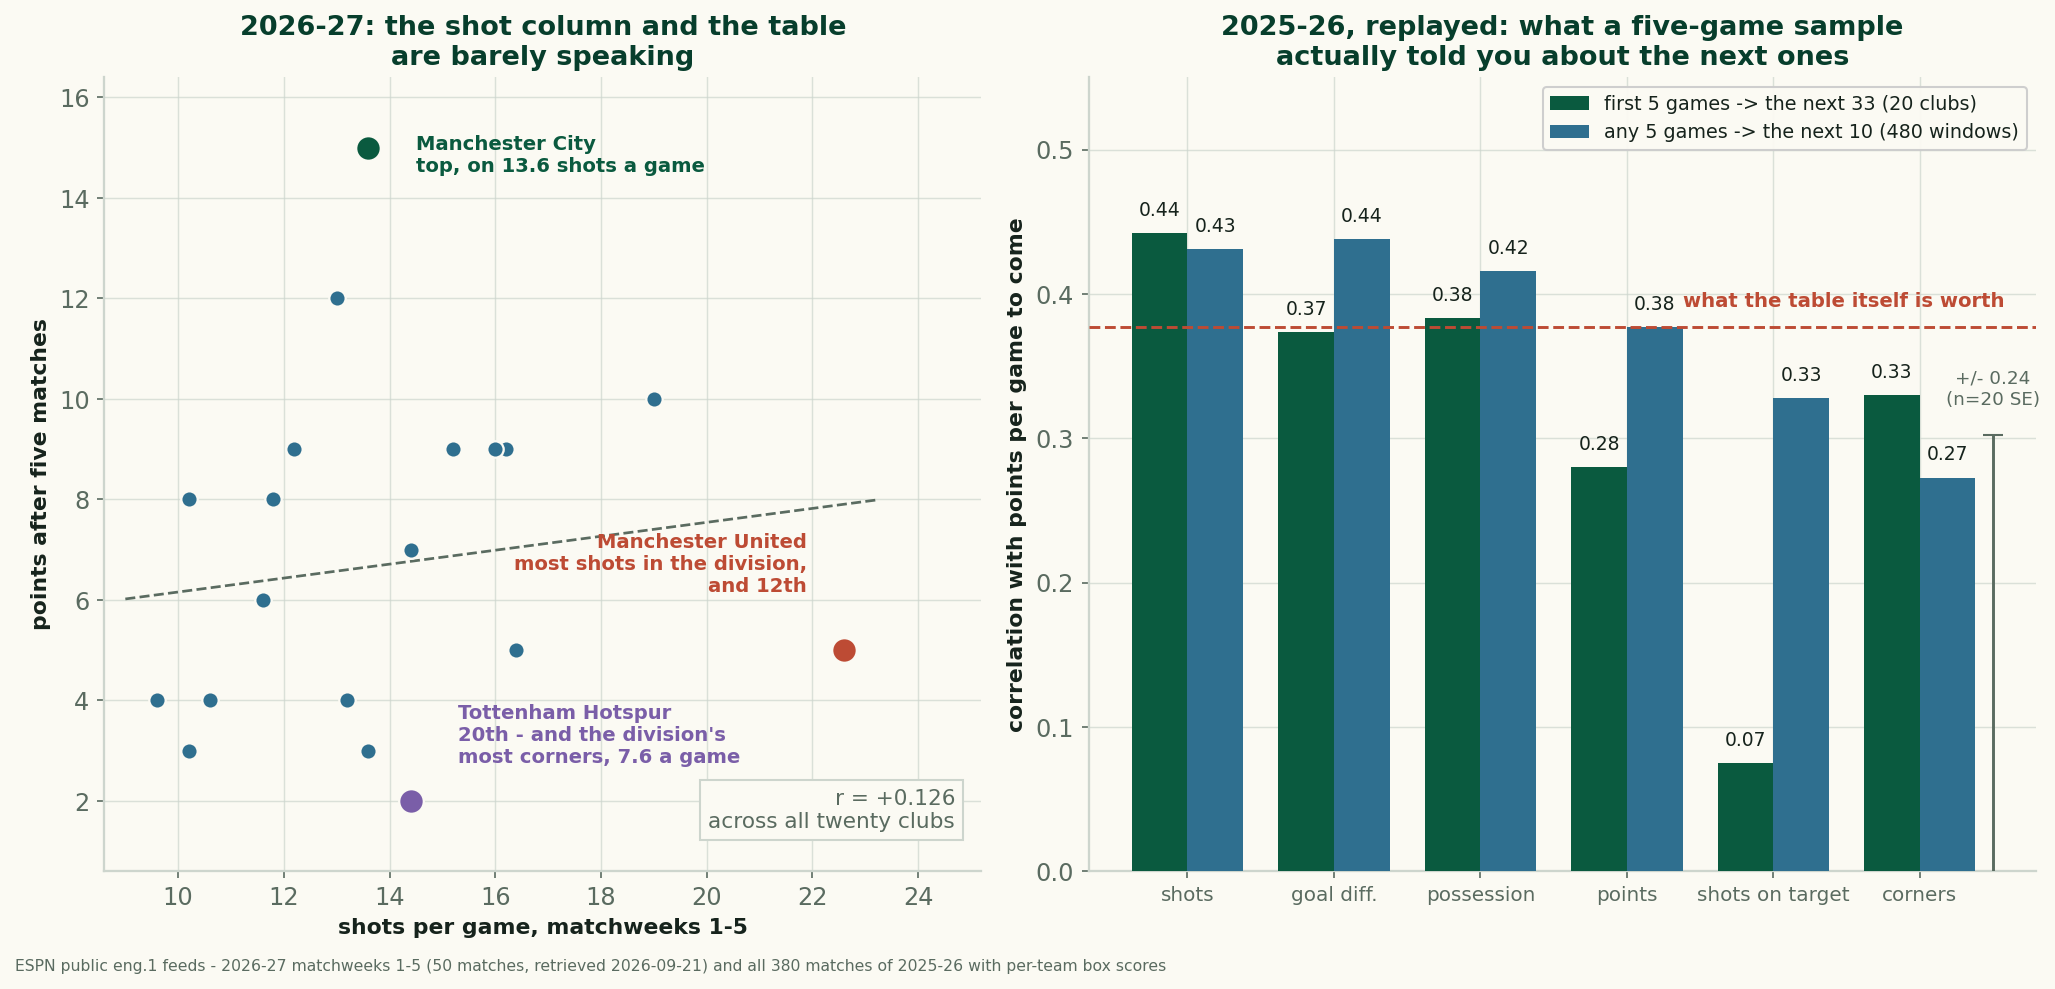
Manchester United Lead the League in Shots and Sit Twelfth
United take 22.6 shots a game and have 5 points. Across 2025-26, a club's five-game shot count predicted its next results better than its points did.
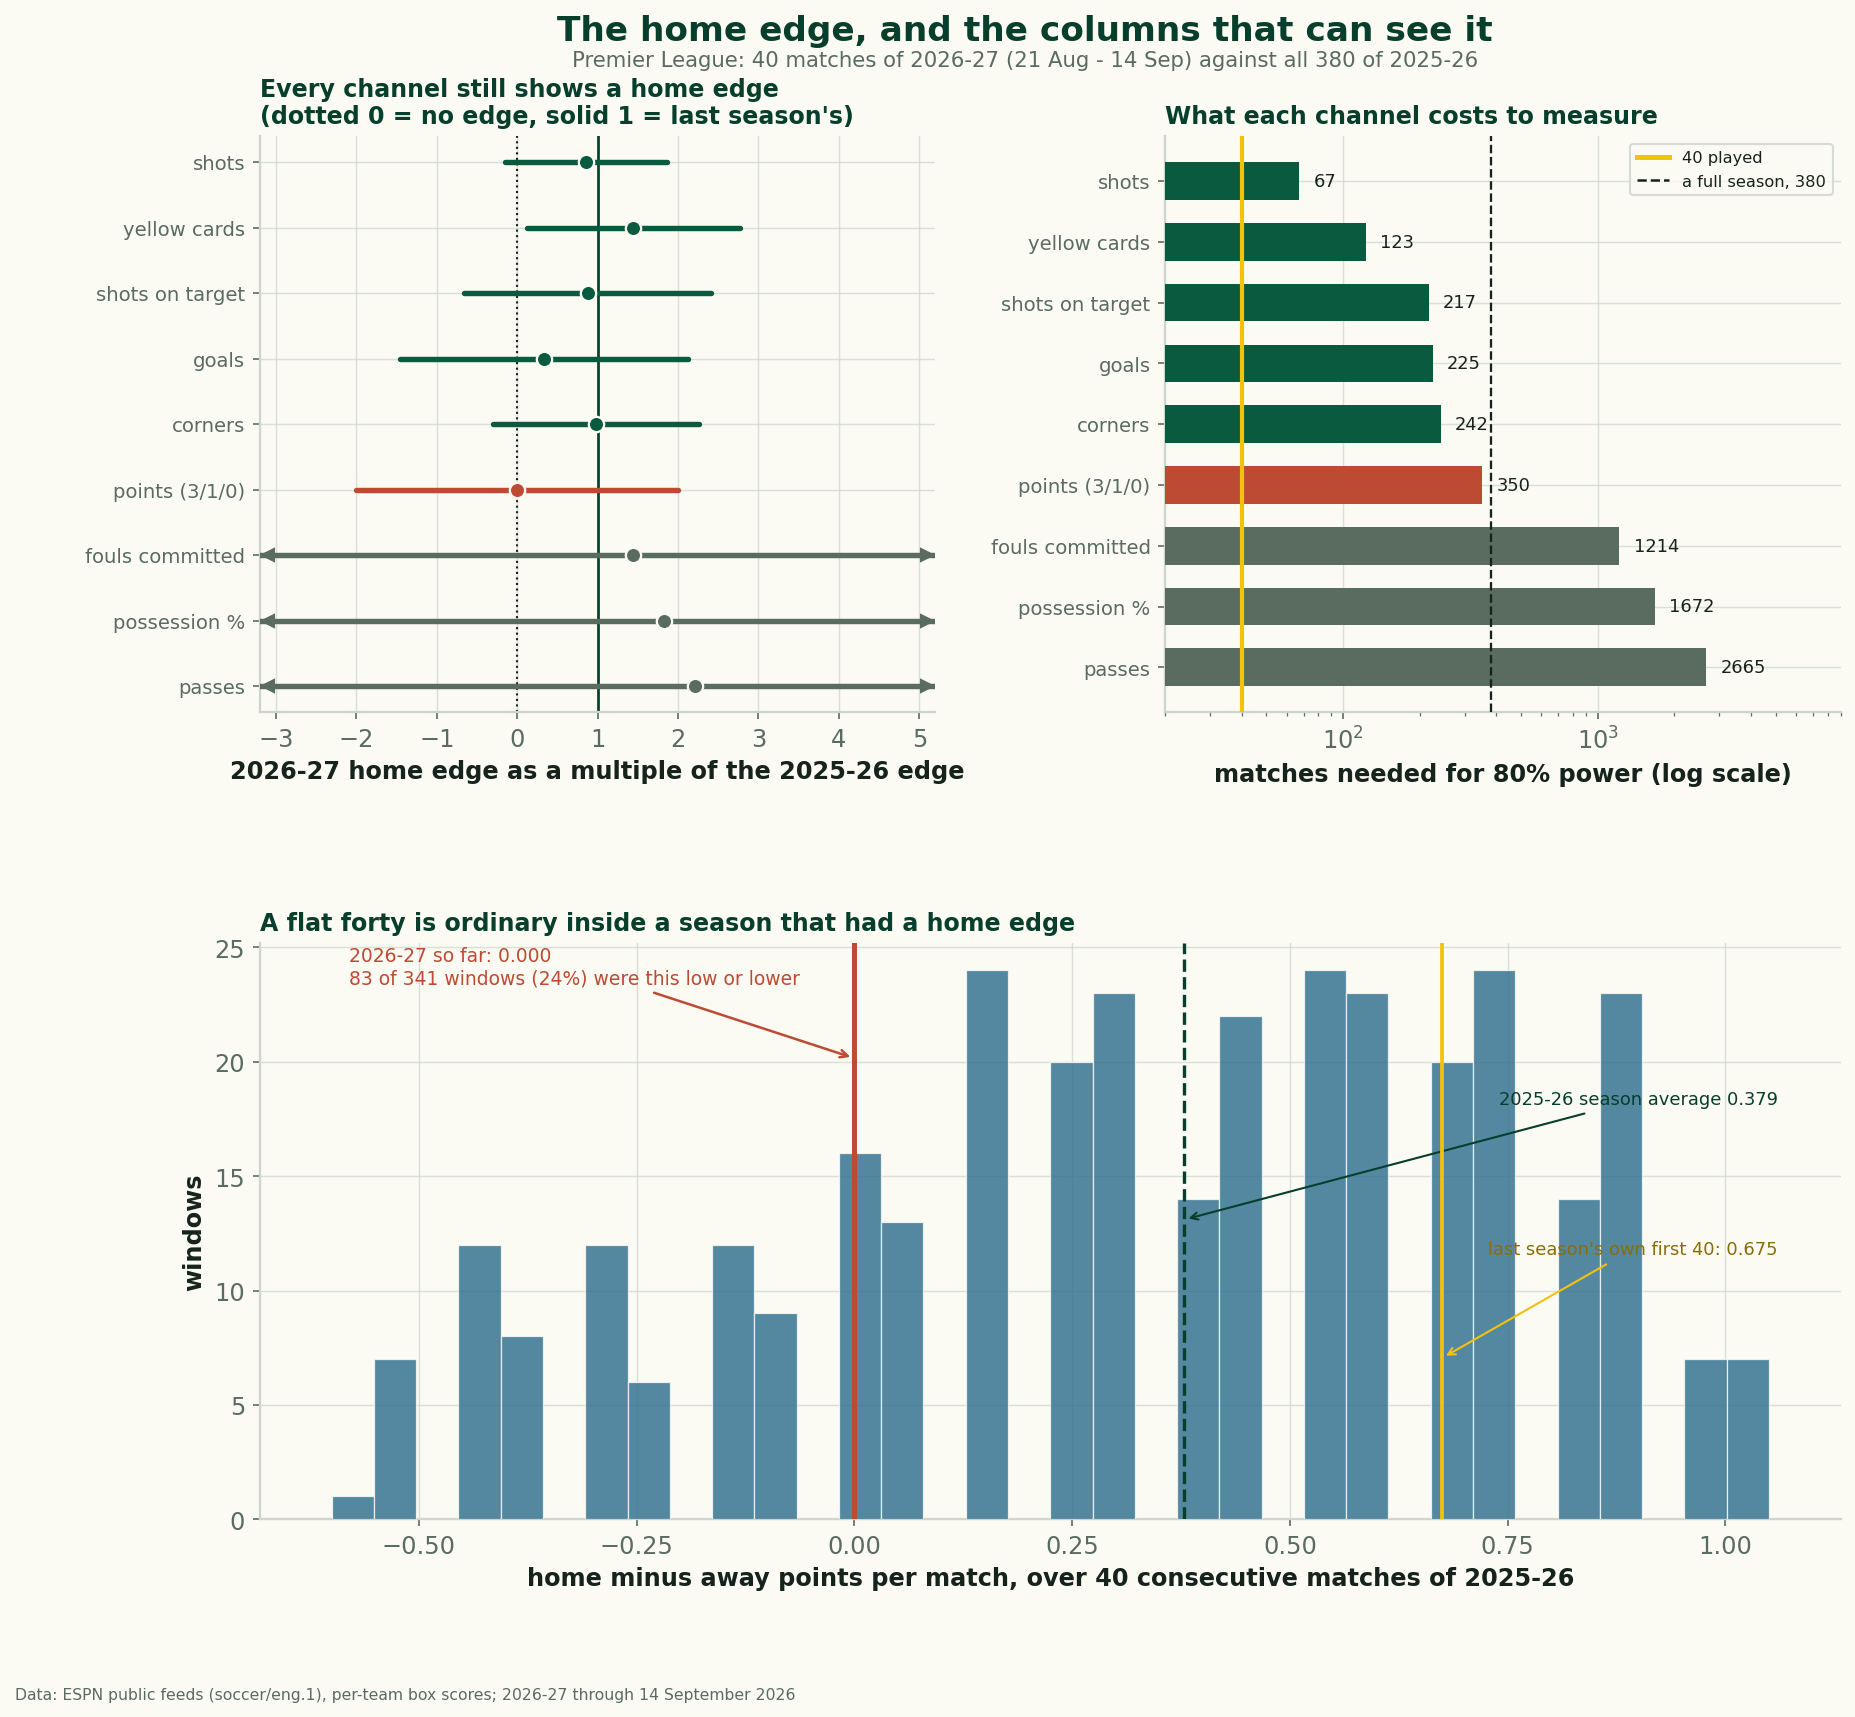
Home Advantage Didn't Die. The Results Column Can't See It
Home and away split the first 40 matches of 2026-27 evenly, yet the shot, corner and card columns keep the home edge. Plus a decade of home-advantage data.