Headers vs. Feet: Which World Cup Shots Actually Go In?
Headers aren't the wasteful shot you think — they convert as well as feet, because they come from closer. The real outlier: the left foot beat its expected goals by a mile.
Ask almost anyone who has watched enough football and they will tell you the same thing: heading is a bad way to try to score. You see a striker rise to meet a cross, glance it wide, and the folk wisdom hardens — headers are wasteful, low-percentage, a shot you take because nothing better is on. I believed a version of that myself. Then I went and counted, and the 2022 World Cup told me something more interesting than the cliché.
Here is the headline before anything else: at Qatar 2022, headers converted at essentially the “same” rate as shots with the feet. Not worse. The genuine outlier in the data isn’t the head at all — it’s the left foot, which beat its expected goals by the widest margin of any body part on the pitch.
Every number in this piece is computed from StatsBomb’s free, public event data for all 64 matches of the 2022 World Cup. Penalties are excluded throughout — a penalty is its own little game and would only distort the foot totals. Nothing here is from memory; it’s all recounted from the shot records. Data provided by StatsBomb.
The raw count, and why it lies a little
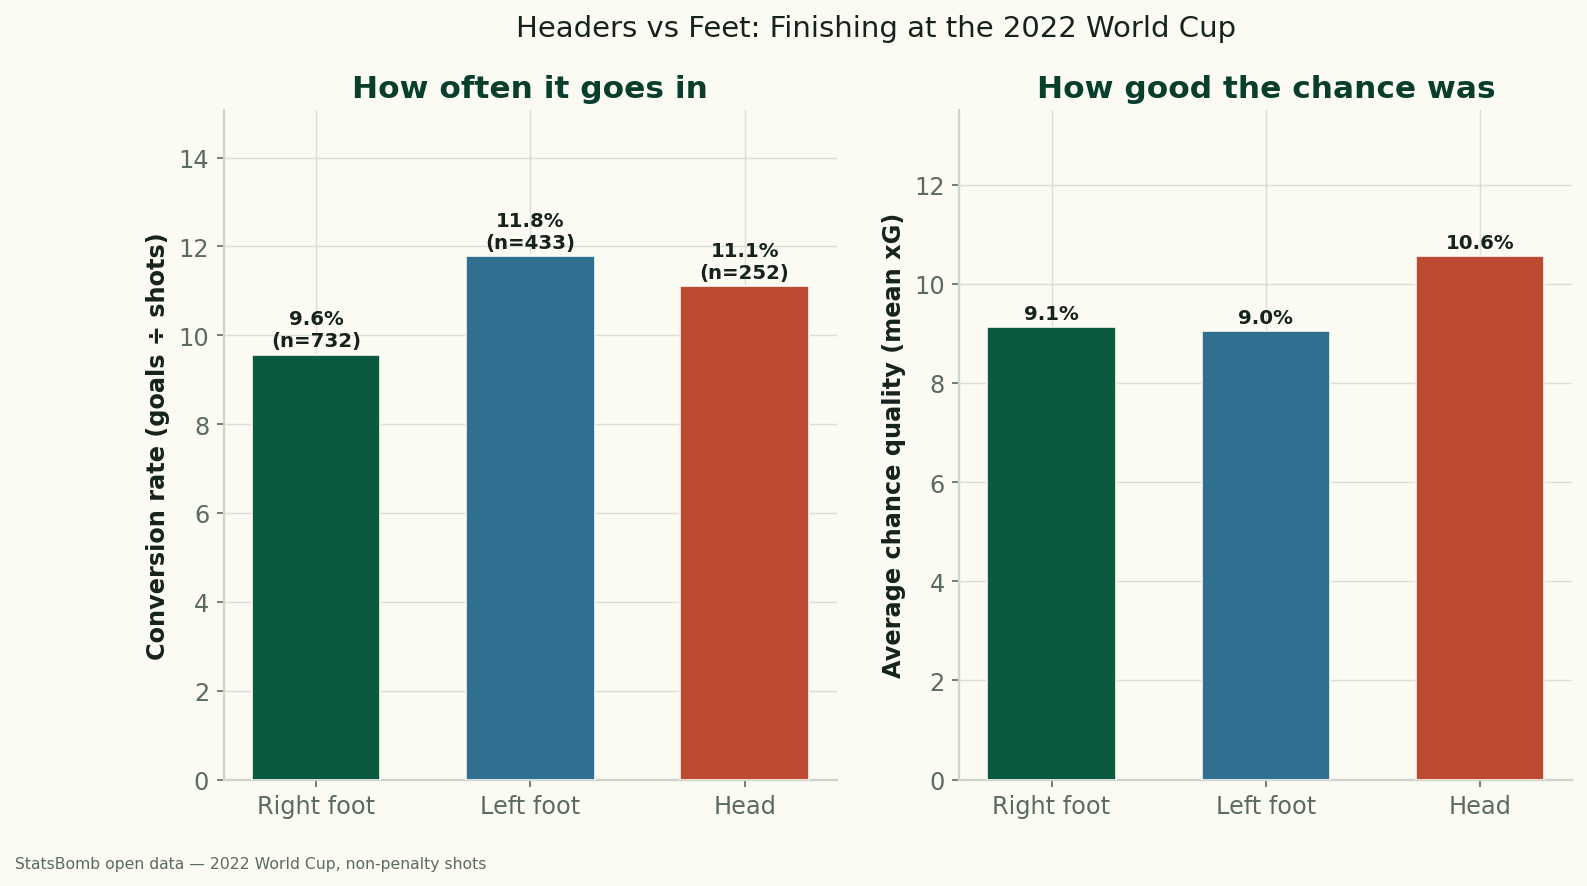
Start with the two big buckets. Feet — left, right, and a handful of “other” foot strikes — produced 1,178 non-penalty shots and 124 goals, a 10.5% conversion rate. Headers produced 252 shots and 28 goals, an 11.1% conversion rate. Read that twice. The header, the shot everyone tells you to avoid, went in slightly more often than the average foot shot.
But raw conversion is a trap, and I want to be honest about why. A conversion rate doesn’t know anything about where the shot was taken from. The average header at this World Cup carried a pre-shot expected-goals value of 0.106; the average foot shot, 0.094. Headers, in other words, came from better places — close range, off crosses, off set pieces, inside the six-yard chaos — because to head a ball toward goal you usually have to be near it. The header isn’t converting well because heading is easy. It’s converting well because the chances are juicier to begin with. If you’ve read where World Cup goals are scored from, the proximity story will feel familiar.
Now do it by body part — the order flips
Split the feet apart and the real picture appears. The right foot took 732 shots, scored 70, converted 9.6%, off a mean xG of 0.091. The left foot took 433 shots, scored 51, converted 11.8%, off a mean xG of 0.090. The head took 252 shots, scored 28, converted 11.1%, off a mean xG of 0.106.
Look at the two feet side by side. They shot from chances of almost identical quality — 0.091 and 0.090 mean xG, a rounding error apart. Yet the left foot converted at 11.8% and the right at 9.6%. Same difficulty of chance, very different outcome. That is the kind of gap that makes me sit up, because it can’t be explained away by “the lefties got the better looks.” They didn’t. They just finished.
A worked example: expected goals vs. what actually happened
This is where comparing goals to expected goals earns its keep. Expected goals (xG) is a model’s estimate of how likely an average shot is to score, given its location, angle, body part, and the situation it came from. Conversion tells you what happened; xG tells you what “should” have happened. Subtract one from the other and you get finishing relative to chance quality. (If xG is new to you, I wrote a fuller primer on expected goals explained.)
Walk the left foot through it. 433 shots at a mean xG of 0.090 implies roughly 433 × 0.090 ≈ 39 expected goals. The left foot actually scored 51. That’s about +12 goals above expectation — roughly 30% more than the model thought those chances were worth. Across a single tournament, +12 is enormous.
Now the head. 252 shots at a mean xG of 0.106 implies about 252 × 0.106 ≈ 27 expected goals. Headers scored 28. That’s +1 — essentially bang on the model. Headers met their xG and not a goal more. The right foot, for completeness, scored 70 against roughly 67 expected, a modest +3.
So here is the order, and notice how it inverts the raw-conversion story. By goals-above-expected, feet beat the model — the left foot spectacularly so — while headers merely matched it. The cliché “headers are wasteful” is simply wrong on conversion: headers go in as often as feet. But the more careful claim — that a header is harder than its position suggests — is defensible relative to xG. Put the same quality of chance in front of a finisher’s foot rather than their forehead and, at this tournament, they squeezed more out of it. I want to be precise here and not overclaim: this is not a “header penalty” in the model. The real story is the left-foot overperformance, plus the unglamorous fact that headers look efficient mainly because they come from better spots.
One more figure worth keeping: headers still accounted for 18.4% of all non-penalty goals (28 of 152). Nearly one World Cup goal in five came off a head. Wasteful is not the word.
Where I’d pump the brakes
A tournament is 64 matches, and 252 headers is a thin sample to hang strong conclusions on. That +12 for the left foot is the most exciting number in this piece and also the one I trust least on its own — some real share of it is probably finishing variance, the polite word for luck. A hot two weeks from a few left-footed forwards can move a tournament-level total a long way.
There’s also a model caveat that cuts the other direction. xG is a model, not truth. It may slightly under-rate left-foot strikes, partly through selection: most players’ stronger foot is their preferred one, and they tend to shoot with it from the setups they’ve manufactured to suit it. If the model doesn’t fully capture that, some of the “overperformance” is really the model under-rating the chance. And headers’ higher xG reflects proximity, not ease — the model already knows headers come from close, which is exactly why their xG is high and their goals-above-expected is flat. Finally, this is World Cup level. Elite finishers, elite delivery; don’t assume the same edges hold in a Tuesday-night league game.
None of that erases the finding. It just sizes it: headers convert as well as feet because they come from better positions, and the left foot was the most clinical body part at the 2022 World Cup relative to the chances it had. If you want to see this with your own eyes, the player-level xG overperformance breakdown and the article on where World Cup players aim both pull at the same thread, and the aerial side gets its own treatment in aerial duels and heading data. You can also poke at individual shots in the interactive shot-map explorer on the World Cup hub.
How to reproduce this
It’s a short recipe. For each shot in data_layer/wc2022_shots.json, group by body_part, then within each group compute conversion as goals divided by shots and chance quality as the mean of the pre-shot xG values, excluding any penalty. Roll left, right, and other foot together to get the “feet” bucket; keep the head separate. Multiply each group’s shot count by its mean xG to get expected goals, and compare against actual goals for the over/under-performance figures above. The whole thing is recomputed end to end by charts/chart_wc2022_body_part.py, which also draws the two-panel figure at the top.
Sources & further reading
- Free textbook: Chapter 7: Expected Goals (xG) Models — the theory behind this, at DataField.dev.
- The data: StatsBomb open data — the free, public event data for all 64 matches of the 2022 World Cup, plus the reproduction script
charts/chart_wc2022_body_part.py. - Related: who overperformed xG at the 2022 World Cup and expected goals explained for the model behind every figure here.
- Data provided by StatsBomb.
More from Data Deep-Dives
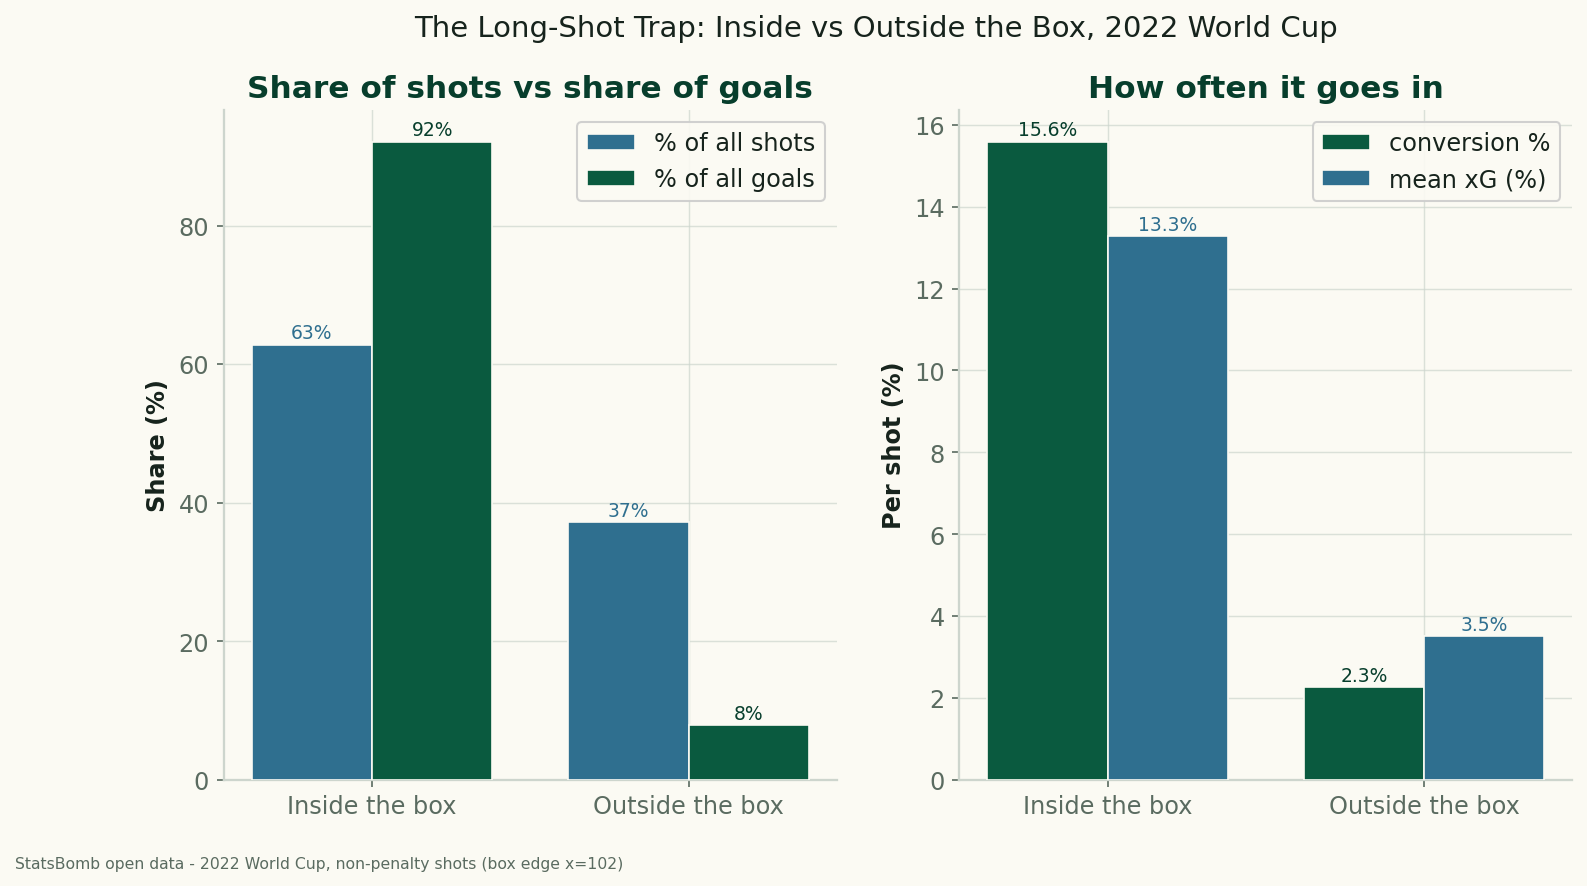
The Long-Shot Trap: Inside vs Outside the Box at the 2022 World Cup
Using StatsBomb data for all 64 matches of the 2022 World Cup, shots from outside the penalty box were 37% of all attempts but produced just 8% of the goals — a 2.3% conversion rate against 15.6% from inside. The data behind 'stop shooting from there.'
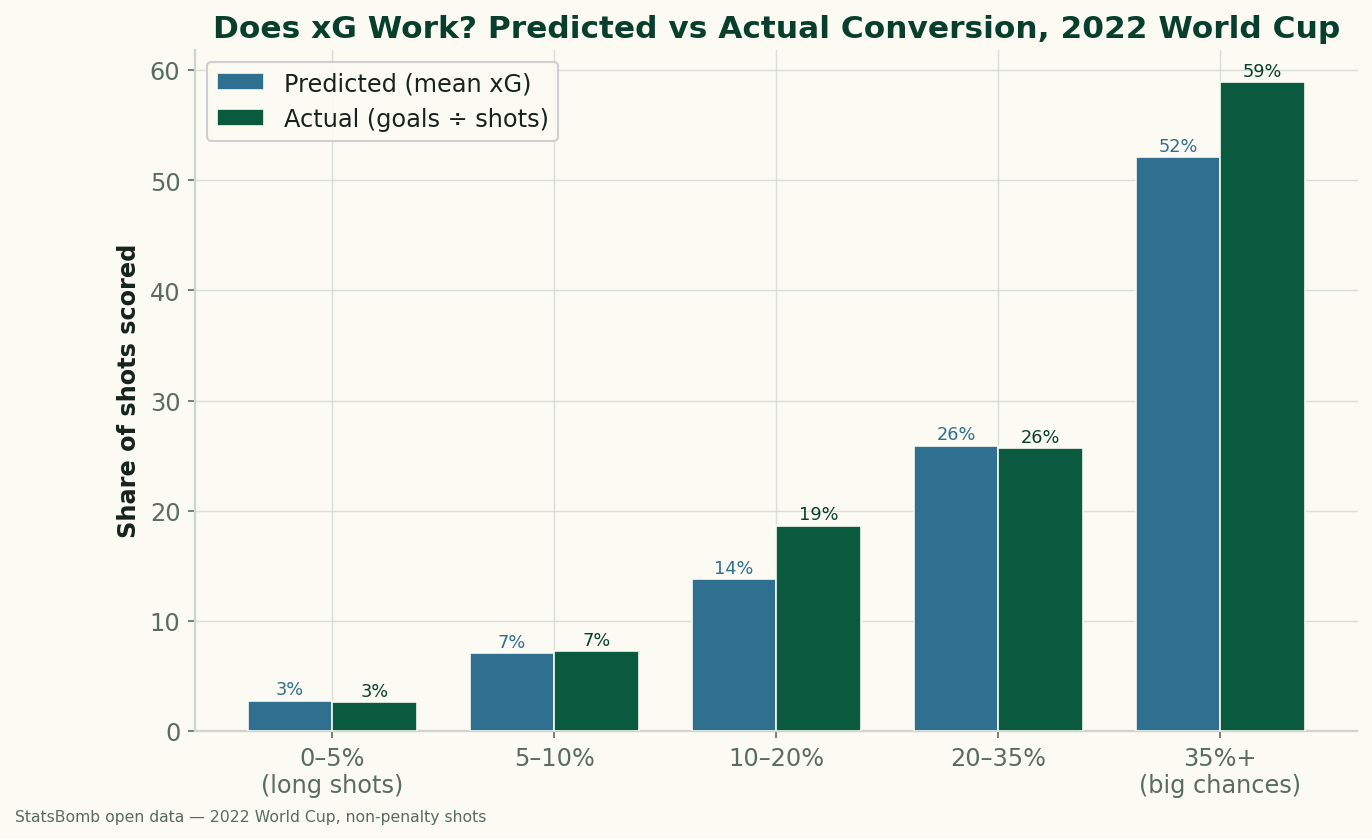
Does xG Actually Work? Big Chances vs Long Shots at the 2022 World Cup
We sorted every non-penalty shot from the 2022 World Cup by its expected-goals value and checked how often each band actually went in. xG holds up well: a 0–5% shot scored 2.6% of the time, a 'big chance' of 35%+ went in 58.9%. The calibration, and what a big chance is really worth.
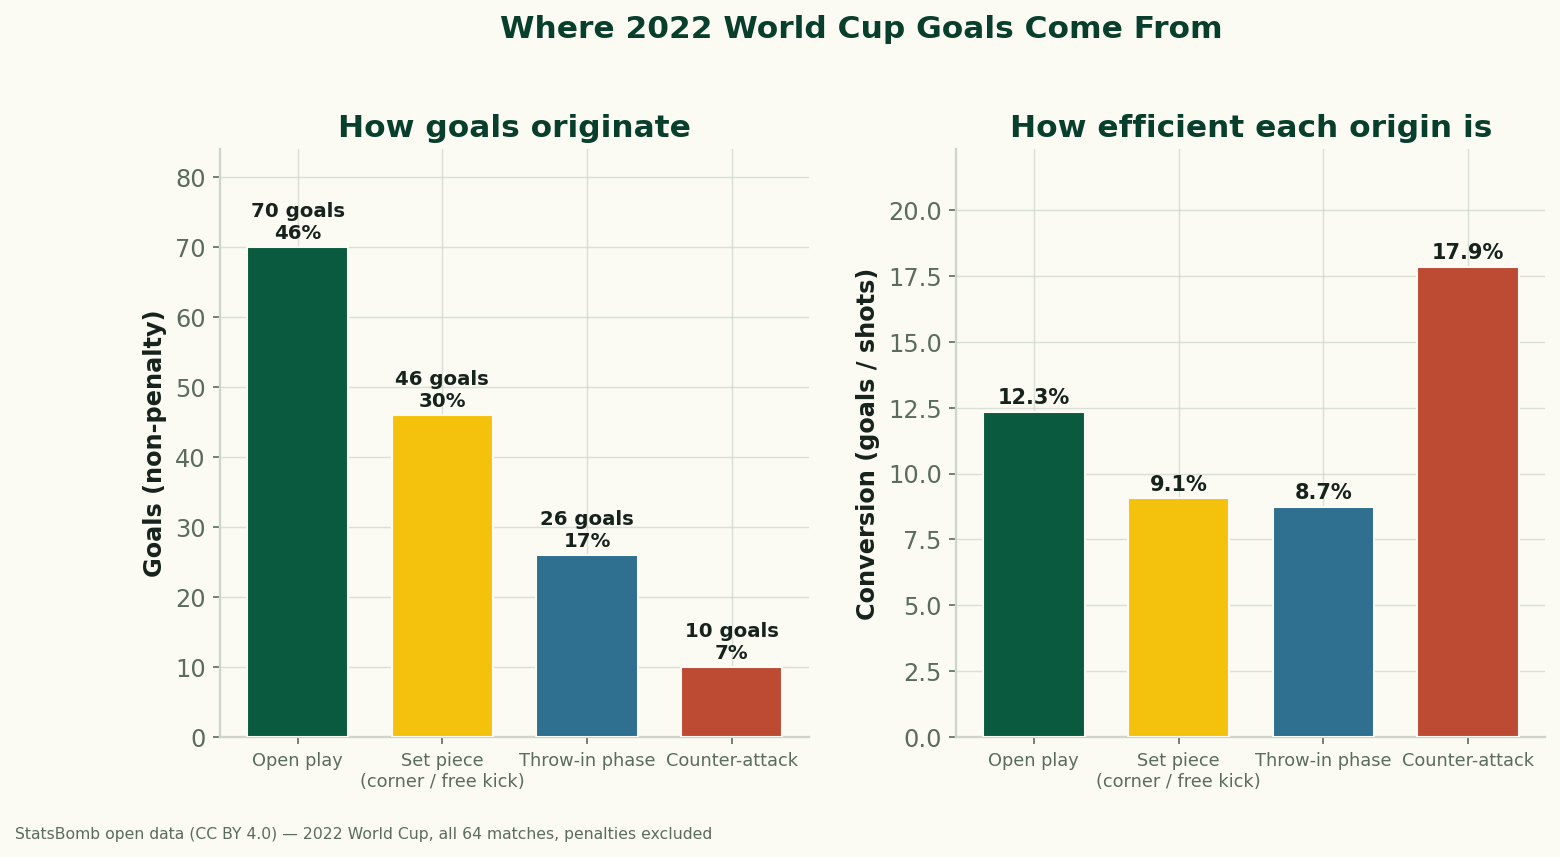
Set Pieces, Open Play, and Counters: Where 2022 World Cup Goals Came From
Using StatsBomb's data for all 64 matches of the 2022 World Cup, we trace every goal back to how the possession began. Set pieces (corners and free kicks) originated 30% of non-penalty goals; open play 46%; and counter-attacks, though rare, converted at 17.9% — nearly double the open-play rate. Where goals really come from.