Reading xG Live During a Tournament Without Overreacting
One match of xG is a rumour, not a verdict. Here is how to listen to it without believing every word.
There is a specific trap that opens up the moment a big tournament starts and the xG numbers begin landing match by match. A team wins comfortably but "lost the xG," and suddenly half the internet has decided they are frauds about to be found out. Another side gets battered on the scoreboard but "won the xG," and the same crowd anoints them dark horses. Both reactions make the identical mistake: treating one match of expected goals as if it were a settled fact about a team's quality, when it is closer to a single noisy rumour. xG is one of the best tools we have for watching a tournament, but only if you read it at the right volume. This piece is about that discipline — what a single game's xG genuinely tells you, what it cannot, and how to stay useful instead of reactive. If you want the foundations first, start with expected goals explained; this is about using it live without getting burned.
What one match of xG actually is
Expected goals assigns every shot a probability of being scored, based on where and how it was taken, and a team's match xG is just the sum of those probabilities. It is a clean, honest summary of the chances a team created and conceded. The problem is not the number; the problem is the sample size. A single match contains a dozen-odd shots per side, and a team's xG total is therefore the sum of a handful of probabilities, each of which is itself an average over thousands of historical shots. Sum a small number of noisy things and you get a noisy thing. One match of xG is a real measurement of a tiny sample, and tiny samples are loud, jumpy, and easy to over-read.
Think of it the way the expected-points framework frames a scoreline: the actual result is a single sample from a distribution of outcomes those chances could have produced. The same is true one level down. A team's true chance-creation quality is a distribution, and any one match's xG is a single draw from it. The draw is informative, but it is one draw. Building a verdict on it is like judging a coin after three flips.
What a single game's xG can tell you
Read at the right volume, one match of xG is still worth a great deal. It tells you, far better than the scoreline does, which side created the better chances — whether a 1–0 was a smash-and-grab or a deserved grind, whether a heavy defeat flattered the winner. It corrects the most basic lie of the scoreboard, that the team which scored more necessarily played better. It flags process-versus-result gaps worth filing away: a team winning while creating little, or losing while creating plenty, is showing you something the result hides, even if you don't yet know whether it will persist. And it lets you grade a performance on chances rather than on the binary of whether the ball went in, which over a knockout match — where one bounce ends a campaign — is the fairer lens. The companion guide how to watch the World Cup with xG walks through doing exactly this match by match.
What single-match xG gives you, in short, is a better description of the game you just watched. That is genuinely valuable. The error is mistaking a better description of one match for a reliable prediction about the next.
What it cannot tell you from one match
Here is where overreaction lives. A single match's xG cannot reliably tell you how good a team is. Chance quality stabilises slowly — it takes many matches before a team's xG numbers settle near their true level — so one game's figure can sit far from the truth purely by chance. It cannot tell you that finishing is "unsustainable" on the evidence of one match; a side might out-finish its xG because it has genuinely elite forwards, or because of one screamer, and ninety minutes cannot separate those. It is badly distorted by game state: a team that scores early and defends a lead will cede shots and xG on purpose, so a raw match total can make a controlled, comfortable win look like a narrow escape. (That distortion, and how to correct for it, is the whole subject of game state and score effects.) And it says nothing about a brilliant goalkeeper or a defensive block that strangled chances before they became shots — the chance that was prevented never enters the number.
A worked hypothetical: same number, two stories
Take a clearly-labelled hypothetical to see why the raw number deceives. Suppose a team finishes a group match having "lost the xG" 1.8 to 0.9 yet won 2–0. The naive reading: lucky, due a regression, secretly poor. But split the match by game state and the story can invert. If the side scored in the opening ten minutes, then sat in a low block and let the opponent pile up half-chances from distance while protecting the lead, much of that 1.8 is low-value territory-without-quality xG that the team was happy to concede. The same scoreline, the same totals, and an entirely different conclusion once you ask when the chances came and what they were worth. (These figures are an illustrative construction to show the mechanism, not a real or predicted match.) The lesson is not that the xG was wrong — it measured the shots faithfully — but that the raw match total, read without context, pointed you the wrong way.
The discipline: how to read live xG without overreacting
A few habits separate useful live xG-watching from the reactive kind.
Accumulate before you conclude. One match is an anecdote; a handful starts to be evidence. Resist the verdict until a team has played enough that its numbers stop lurching. If you must react to one game, react to the description ("they created little today") not the projection ("they're frauds").
Split by game state. Before trusting a match total, ask who was ahead and when. A team defending a lead and a team chasing a deficit generate xG for opposite reasons, and the raw sum blends them into mush. The split is where the real signal hides.
Separate chances from finishing. "Created good chances" and "finished well" are different skills measured by different things. A pre-shot xG total grades the first; for the second — and for whether a goalkeeper stole a result the run of play didn't deserve — you need post-shot xG and goalkeeper metrics. Don't let one number answer two questions.
Treat over- and under-performance as a question, not an answer. A team beating its xG is flagged for attention, not convicted of luck. Sometimes it is variance that will regress; sometimes it is finishing skill or chance-prevention the model can't see. The honest move is to note the gap and keep watching, not to declare its cause after one match.
Hold the number at tournament arm's length. The 2026 World Cup is being played as this is written, and one group-stage performance — good or bad on xG — is a tiny, noisy slice of a side. The whole point of reading xG well is to be less swayed by single results, not to find a more sophisticated way of overreacting to them.
Try the per-match calculator
To feel how a single match's chances translate into win, draw and loss probabilities — and why one game settles so little — use the xG→outcome calculator. Enter two xG totals and watch the scoreline grid resolve into the three outcome probabilities and the expected points each side banked. The instructive part is the spread: even a clear xG edge leaves a meaningful chance the other team wins on the day, which is exactly why one match's result is a single sample, not a verdict on quality.
This calculator needs JavaScript. The method: model each team's goals as Poisson with mean equal to its total xG, build the scoreline grid, sum it into win / draw / loss, then xPoints = 3·P(win) + 1·P(draw).
Open this calculator on the tools page → | Read the method in full →
The takeaway
Live xG is a microphone, not a megaphone. It lets you hear what a match was really about — who created, who got lucky, who was strangled by a defensive plan — far more clearly than the scoreboard does. But it picks up a lot of noise along with the signal, and one match is almost all noise. The skill is listening at the right level: trust xG to describe the game you watched, accumulate matches before you trust it to describe a team, split by game state before you trust a total, and reach for post-shot data before you blame finishing. Do that, and xG becomes the thing that keeps you calm while everyone else is overreacting to a single result — which, at a tournament where one match can end a nation's summer, is the most valuable temperament an analyst can have.
Sources & further reading
- Free textbook: Chapter 7: Expected Goals (xG) Models — the theory behind this, at DataField.dev.
- Expected Goals Explained — the foundation: what an xG number is and how it's built.
- Expected Points from xG — turning one match's chances into win/draw/loss and the per-match calculator.
- Game State and Score Effects — why who's leading distorts a raw xG total, and how to split it.
- Post-Shot xG and Goalkeeper Metrics — separating chance creation from finishing and goalkeeping.
- How to Watch the World Cup with xG — putting live xG-reading into a full match-watching routine.
More from World Cup 2026
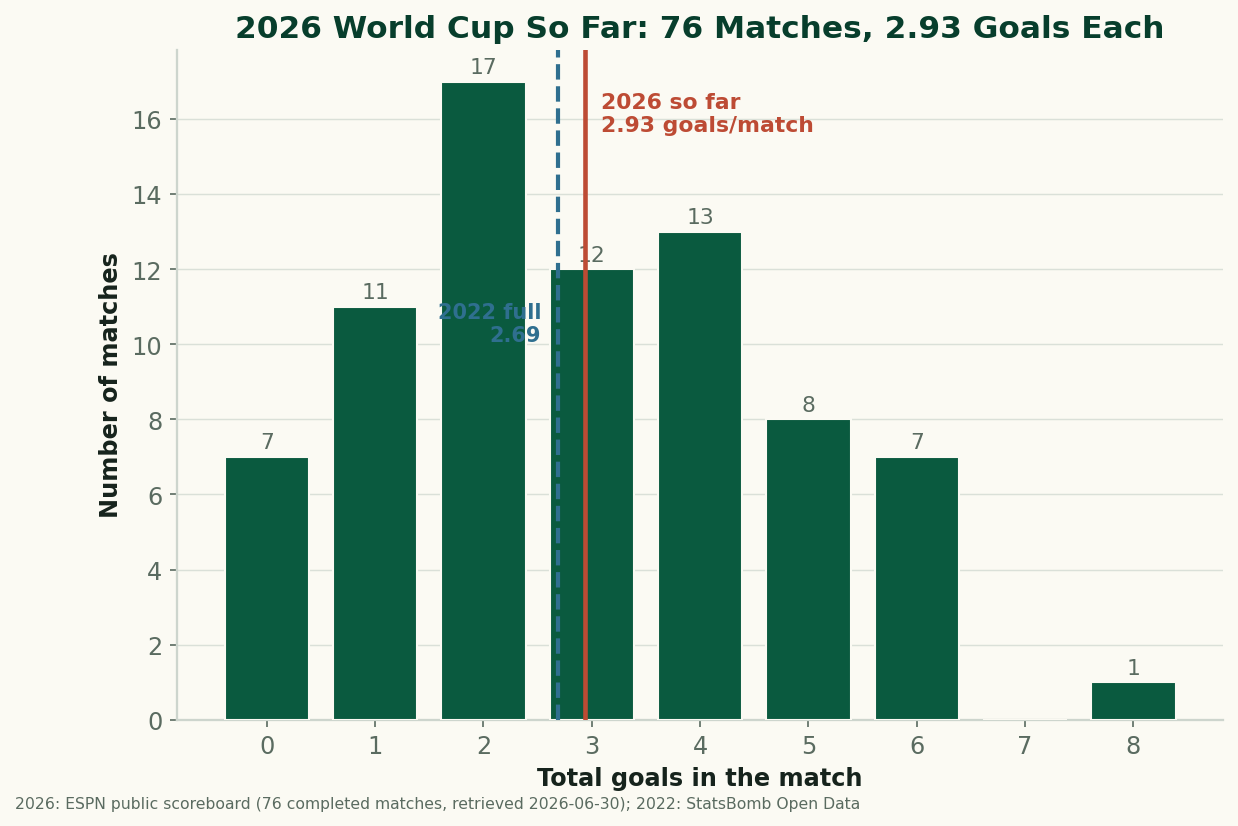
The 2026 World Cup So Far, By the Numbers: Just Under 3 Goals a Game
Through 76 completed matches, the 2026 World Cup is still outscoring 2022 — 2.93 goals a game to 2.69. After an early spike the rate has settled just under 3 a game. The real, sourced numbers on goals, draws, and the blowouts behind them, with honest caveats about a group-stage-only sample. (A living snapshot, refreshed as games are played.)
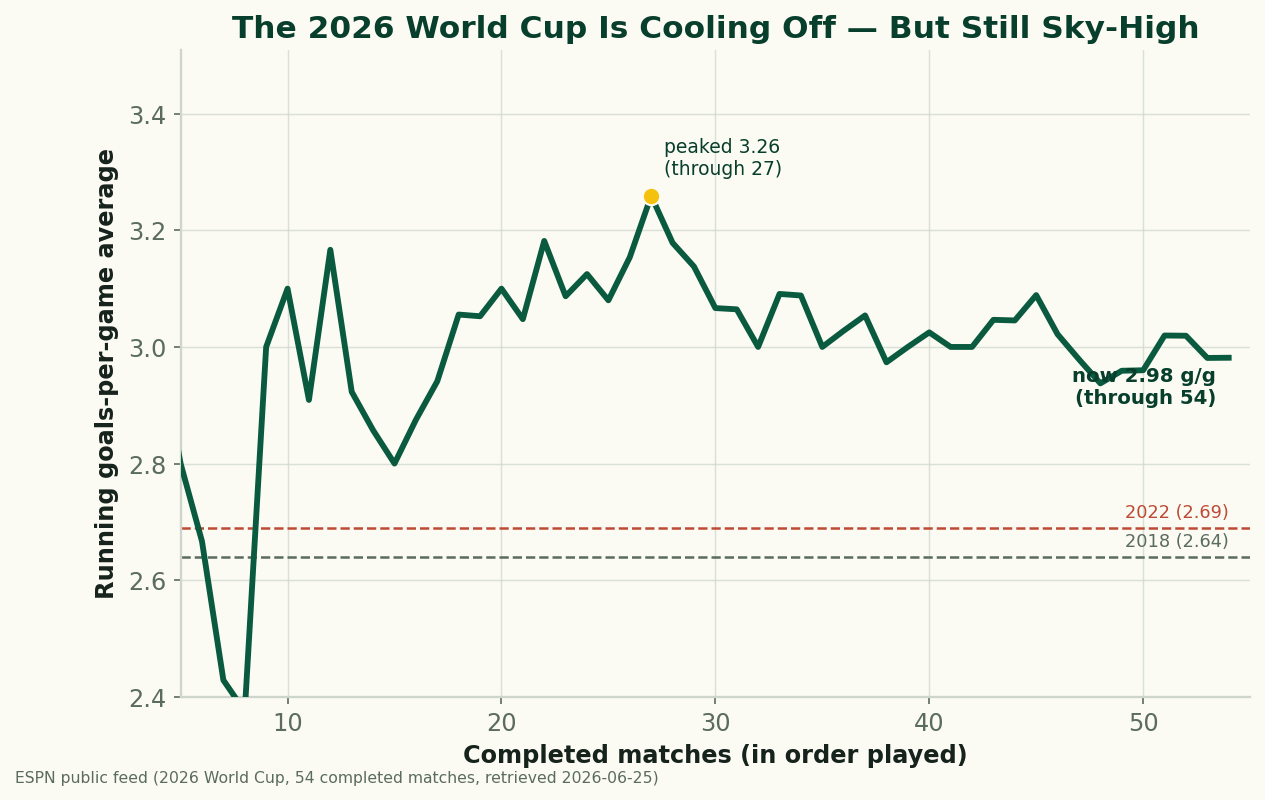
The 2026 World Cup Is Cooling Off — and Still the Highest-Scoring in Generations
Through 54 completed matches, the 2026 World Cup is averaging 2.98 goals a game — down from a blistering 3.26 early on, but still comfortably above 2022 (2.69) and 2018 (2.64), and the highest-scoring World Cup since 1970. A refreshed look at where the goals are going as the group stage closes.
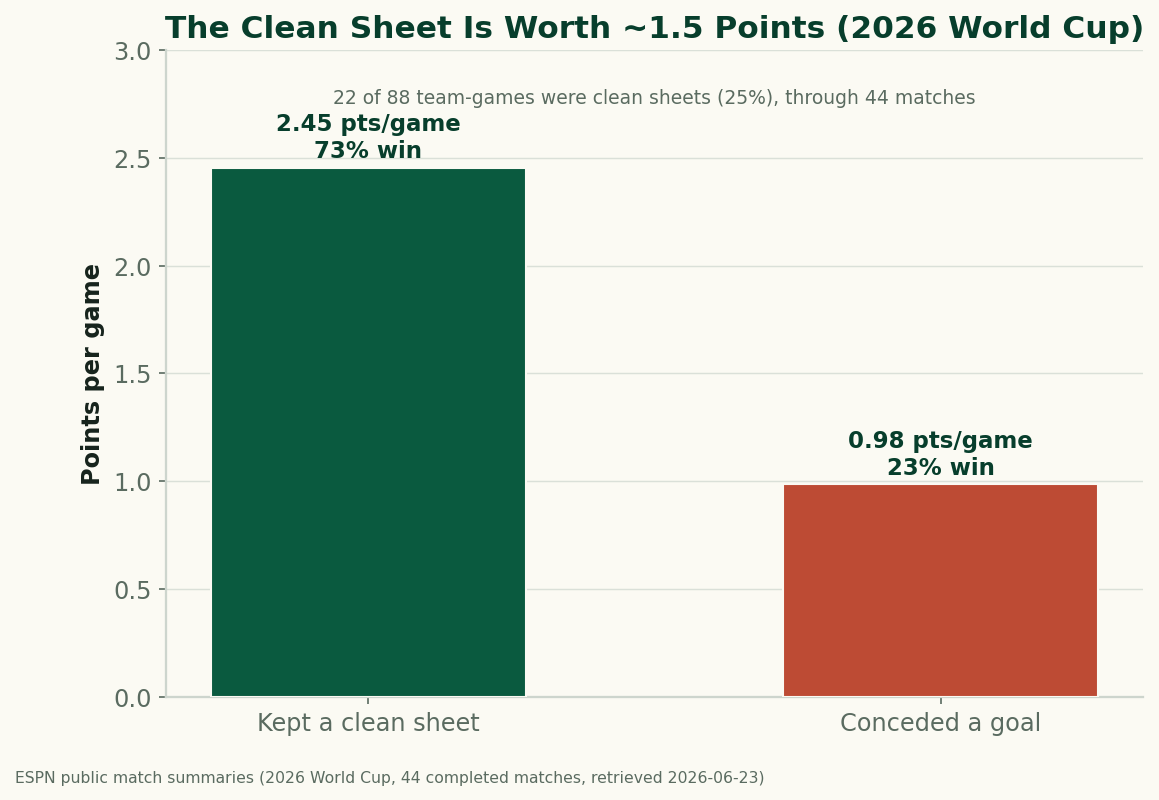
The Clean Sheet Is the Most Valuable Thing at the 2026 World Cup
Through 44 completed matches, a team that keeps a clean sheet at the 2026 World Cup averages 2.45 points and wins 73% of the time; a team that concedes averages under 1. Don't concede and you almost can't lose — the data on what a clean sheet is worth.