The Long-Shot Trap: Inside vs Outside the Box at the 2022 World Cup
Outside-the-box shots are a third of all attempts and a twelfth of the goals. The numbers on why the long shot is usually the wrong choice.
The long shot is the most seductive bad decision in football. The crowd rises before the ball is struck, the replay looks glorious on the rare night it flies in, and the player who tries it looks brave. But the numbers are merciless. Take every non-penalty shot from all 64 matches of the 2022 World Cup and split it by one line — the edge of the penalty box — and the gap is stark. Shots from outside the box were 37% of all attempts but produced just 8% of the goals. Inside the box, the same data shows a 15.6% conversion rate; outside it, 2.3%. A shot from inside the area is about seven times more likely to score. The long shot, almost always, is the wrong choice.
Sourcing. Every figure below is from StatsBomb's free open data for all 64 matches of the 2022 World Cup, penalties excluded, with the box edge defined at x=102 on StatsBomb's 120-unit-long pitch. The xG figures come from StatsBomb's own model. Nothing here is invented; the split is reproducible from the raw event data.
The exhibit
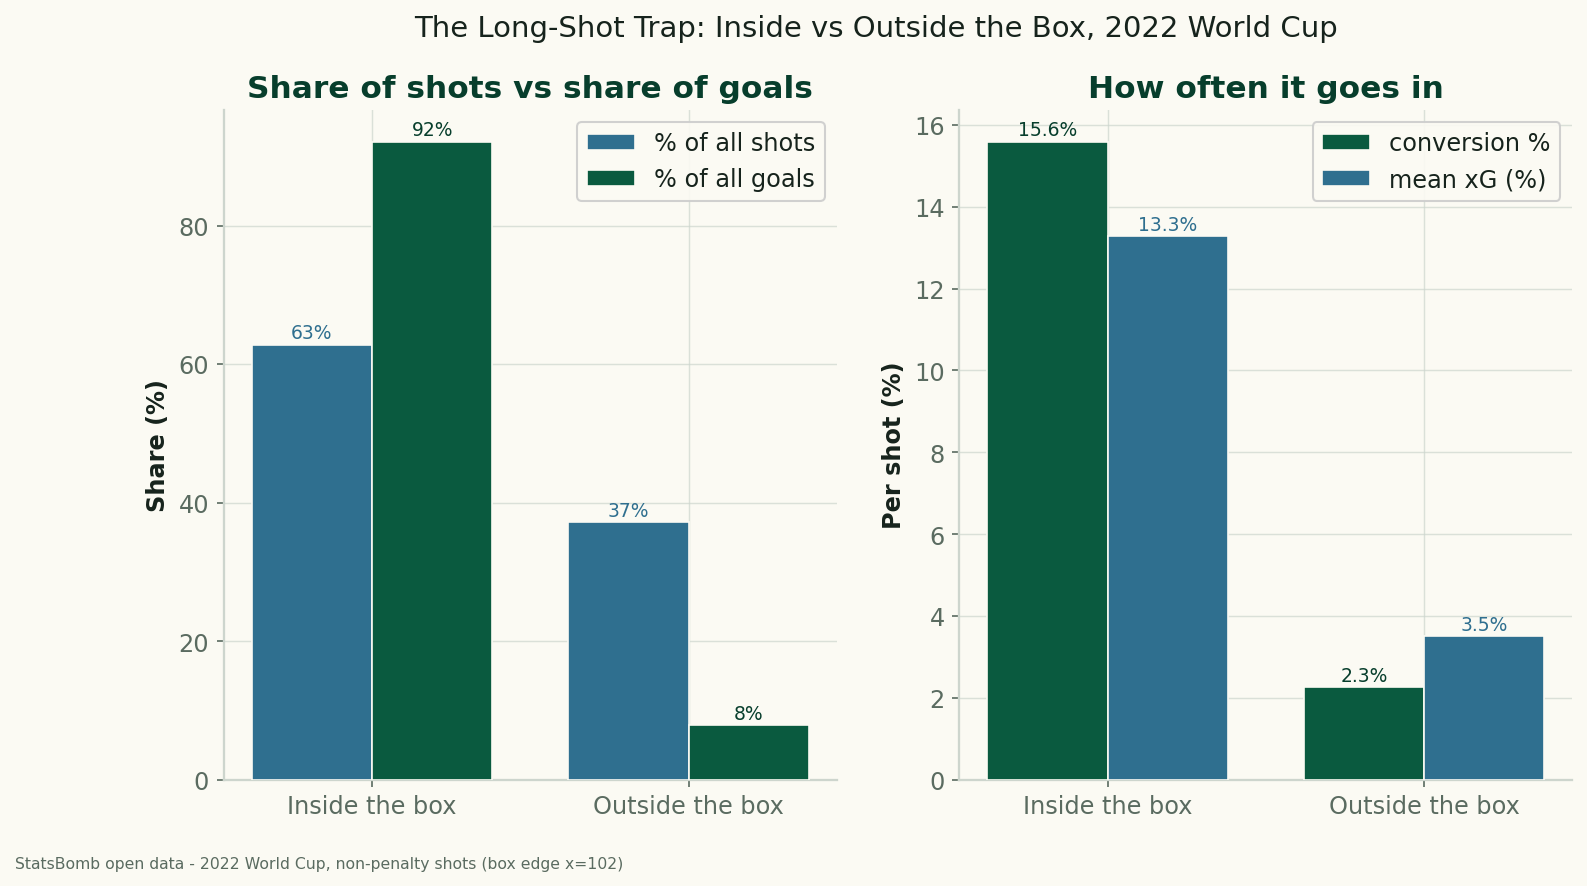
The left panel is the whole argument in two pairs of bars. Inside the box accounted for 898 shots — 63% of every attempt — and 140 goals, or 92% of all the non-penalty goals scored at the tournament. Outside the box: 532 shots, a full 37% of attempts, but only 12 goals — 8% of the total. More than a third of the shooting effort of the world's best teams returned one goal in twelve. The right panel tells you why nobody should be surprised: inside-box shots convert at 15.6% and carry a mean xG of 13.3%; outside-box shots convert at 2.3% with a mean xG of just 3.5%. The model and the scoreboard agree almost exactly, on both sides of the line.
What the box edge actually means
StatsBomb records every event on a pitch normalised to 120 units long and 80 wide, with the goal at x=120. The penalty area begins at x=102 — 18 units, the regulation 18 yards, from the goal line. That single coordinate is the cleanest available proxy for “close enough to be a high-value chance.” Cross it and the geometry of finishing changes fast: the keeper has less time to react, the angle to the posts opens up, and defenders have less room to block. Step back behind it and the ball has further to travel, the keeper has more time to set, and a foot of defensive deflection is enough to ruin the line. Distance is the single biggest driver of chance quality in every public xG model, and this is what that looks like in one tournament.
A worked example: the 532 shots that weren't
Hold the worked example in your head, because it is the entire case for shooting less from distance. Those 532 outside-the-box attempts converted at 2.3% and produced 12 goals. Now run the counterfactual: imagine the same 532 attempts had instead been taken from inside the box, where the tournament conversion rate was 15.6%. That's 532 × 0.156 ≈ 83 goals — against the 12 those shots actually yielded. The same number of shooting opportunities, relocated to the other side of one line, would have been worth roughly seven times as many goals. That is the long-shot trap in a sentence: every speculative effort from 25 yards is, on average, a chance to have worked the ball into a position worth far more. The arithmetic is the same logic that makes the overrated cross a poor first option — high volume, low yield — and it rhymes with what the data says about where World Cup goals actually come from: overwhelmingly, from close range and central angles.
When the long shot is still right
This is a tendency, not a commandment, and intellectual honesty demands the exceptions. Some long shots are genuinely the correct decision:
- A clear sight with no better option. If the lanes to goal are sealed and there is no closer pass available, a 2.3% shot beats a 0% non-shot — and it can force a rebound or a corner.
- A specialist taking it. Tournament-wide averages flatten the handful of players whose long-range conversion genuinely beats the field. For them the math is different.
- Game state. Late and chasing, a team trailing rationally accepts low-probability shots because the value of a goal has spiked and possession is worth less. The score-effects literature is clear that shot selection should shift with the clock.
- Deflections and rebounds. A blocked long shot that falls kindly, or one that takes a touch off a defender, can create a high-value second chance that never shows up in the original shot's xG.
The honest limitations
Several caveats sit on top of the headline split, and they matter:
- The cutoff is binary. x=102 treats a shot from one inch outside the box exactly like one from the halfway line, and a shot from the penalty spot the same as one from a tight angle by the byline. Distance and angle and defensive pressure are continuous; one line throws all of that away. It is a useful proxy, not a complete model of chance quality.
- Survivorship and team quality. Teams that generate lots of inside-box chances tend to be the better teams — they pass through defences rather than settle for distance. So part of the inside/outside gap reflects who is taking which shots, not just where they're taken from. The split describes shot locations; it doesn't fully isolate the decision.
- One tournament. This is 64 matches, not a universal law. The 532 outside-the-box shots are a healthy sample, but a single World Cup can run hot or cold; the 12 goals there could plausibly have been eight or sixteen.
- xG is a model. The 13.3% and 3.5% mean-xG figures are StatsBomb's estimates, not ground truth. They line up almost perfectly with the realised conversion rates here, which is reassuring, but they remain modelled values with their own assumptions.
Why this is the consensus, not a hot take
None of this is controversial inside the analytics world. The dominant finding of a decade of public xG work is that shot distance is the single largest factor in the probability a shot becomes a goal — larger than whether it's a header or a foot, larger than most contextual variables. StatsBomb's open xG model encodes exactly that, which is why its mean-xG numbers track the realised conversion so closely on both sides of the box edge. If you want the underlying intuition, the primer on expected goals walks through why location dominates, and the look at whether big chances get scored at the World Cup shows the same model behaving well at the high-value end of the curve. Even the headers-versus-feet question, once you control for it, is mostly a distance story in disguise — headers happen close in.
Reproduce it
The method is deliberately simple, which is the point. Load StatsBomb's open event data for all 64 matches of the 2022 World Cup, keep only shots, drop penalties, and split each remaining shot on whether its x-coordinate is at or beyond 102. For each side, count the shots, count the goals, and compute the conversion rate (goals over shots) and the mean of StatsBomb's xG values. That yields the inside split (898 shots, 140 goals, 15.6%, mean xG 13.3%) and the outside split (532 shots, 12 goals, 2.3%, mean xG 3.5%). The two-panel figure is regenerated by charts/chart_wc2022_long_shots.py. If you'd rather poke at the raw shots yourself, the shot-map explorer on the World Cup hub lets you filter the same 2022 attempts by location.
The takeaway
Shooting from outside the box is not always wrong, but it is wrong far more often than it feels. At the 2022 World Cup it ate up more than a third of all attempts and returned one goal in twelve, at a rate seven times worse than shots from inside the area. The long shot will keep getting on the highlight reel precisely because it is rare and improbable — that's what makes it a highlight. But for a team deciding what to do with the ball 25 yards out, the data has one quiet instruction: work it closer.
Sources & further reading
- Free textbook: Chapter 6: The Soccer Pitch as a Coordinate System — the theory behind this, at DataField.dev.
- Data: StatsBomb open data — event data and xG model for all 64 matches of the 2022 World Cup; non-penalty shots split at x=102 and charted by
charts/chart_wc2022_long_shots.py. Data provided by StatsBomb. - Background: Expected goals explained — why shot distance dominates chance quality.
- Companion: Where World Cup goals are scored from and Do big chances get scored? — the same StatsBomb data viewed from the goal end.
More from Data Deep-Dives
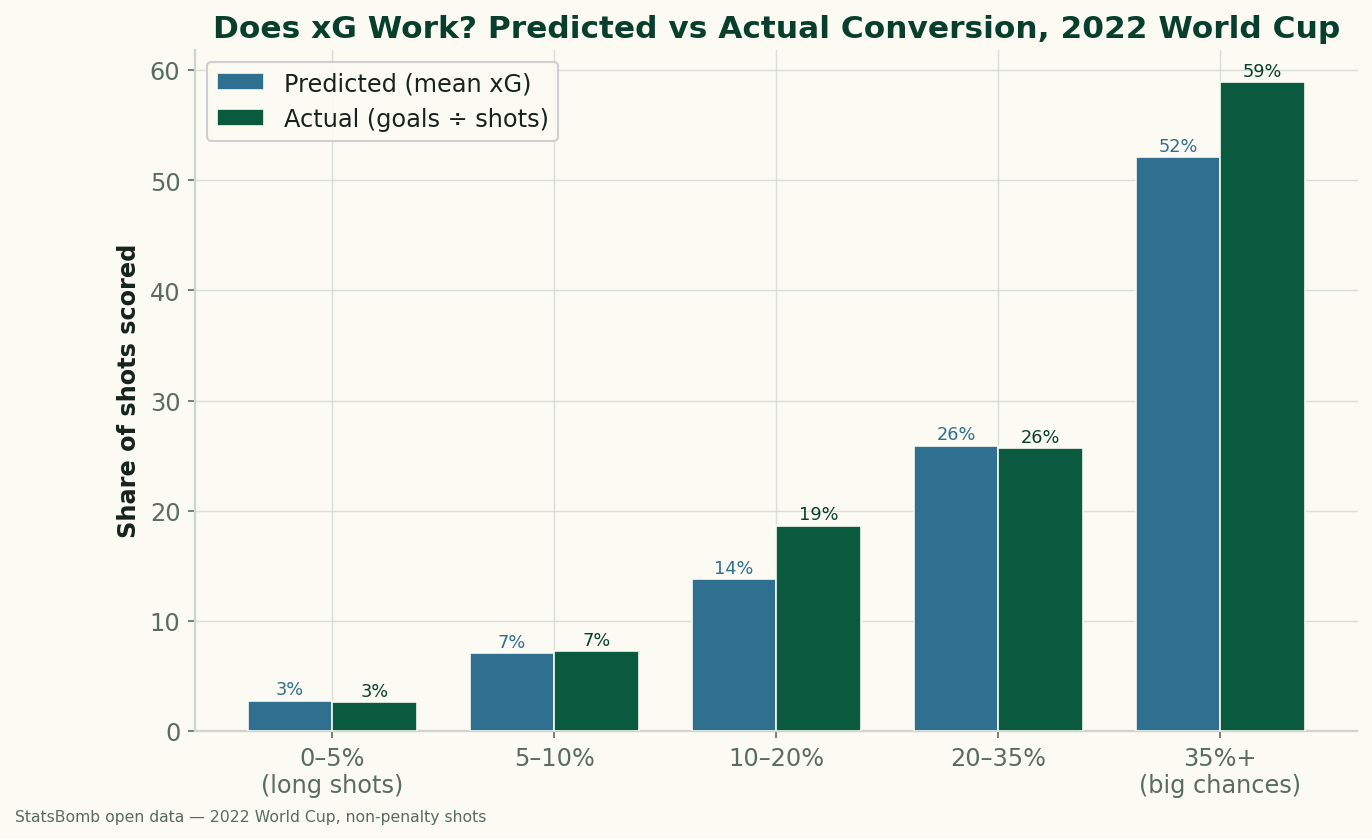
Does xG Actually Work? Big Chances vs Long Shots at the 2022 World Cup
We sorted every non-penalty shot from the 2022 World Cup by its expected-goals value and checked how often each band actually went in. xG holds up well: a 0–5% shot scored 2.6% of the time, a 'big chance' of 35%+ went in 58.9%. The calibration, and what a big chance is really worth.
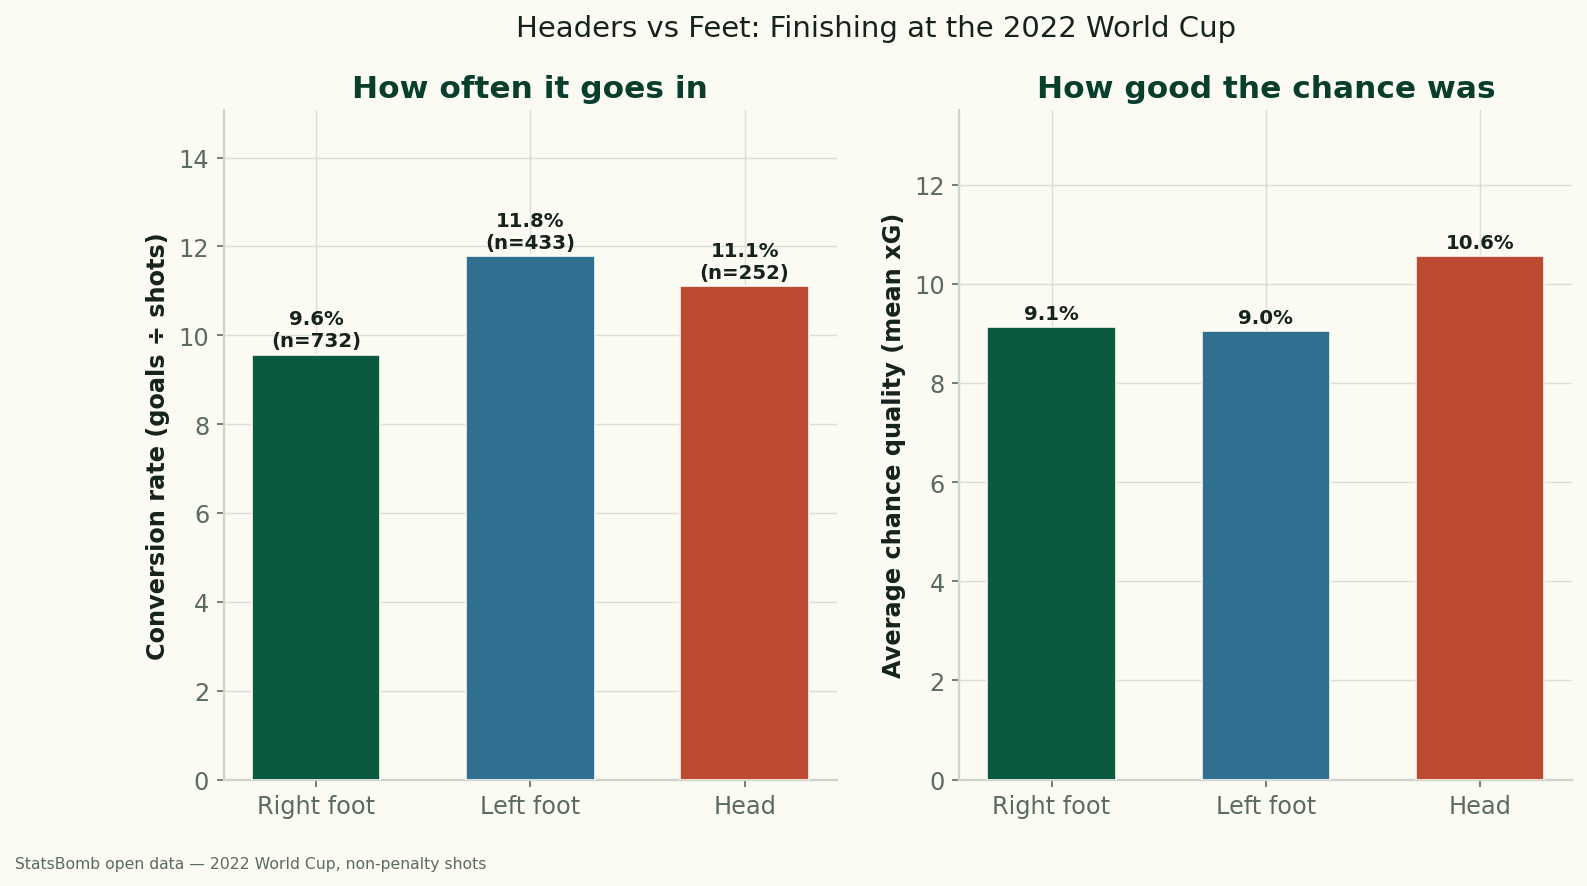
Headers vs. Feet: Which World Cup Shots Actually Go In?
Using StatsBomb data for all 64 matches of the 2022 World Cup, headers and feet convert at almost the same rate (11.1% vs 10.5%) — but only because headers come from higher-quality positions. Relative to chance quality, foot finishing beat the model, and the left foot was the most clinical of all.
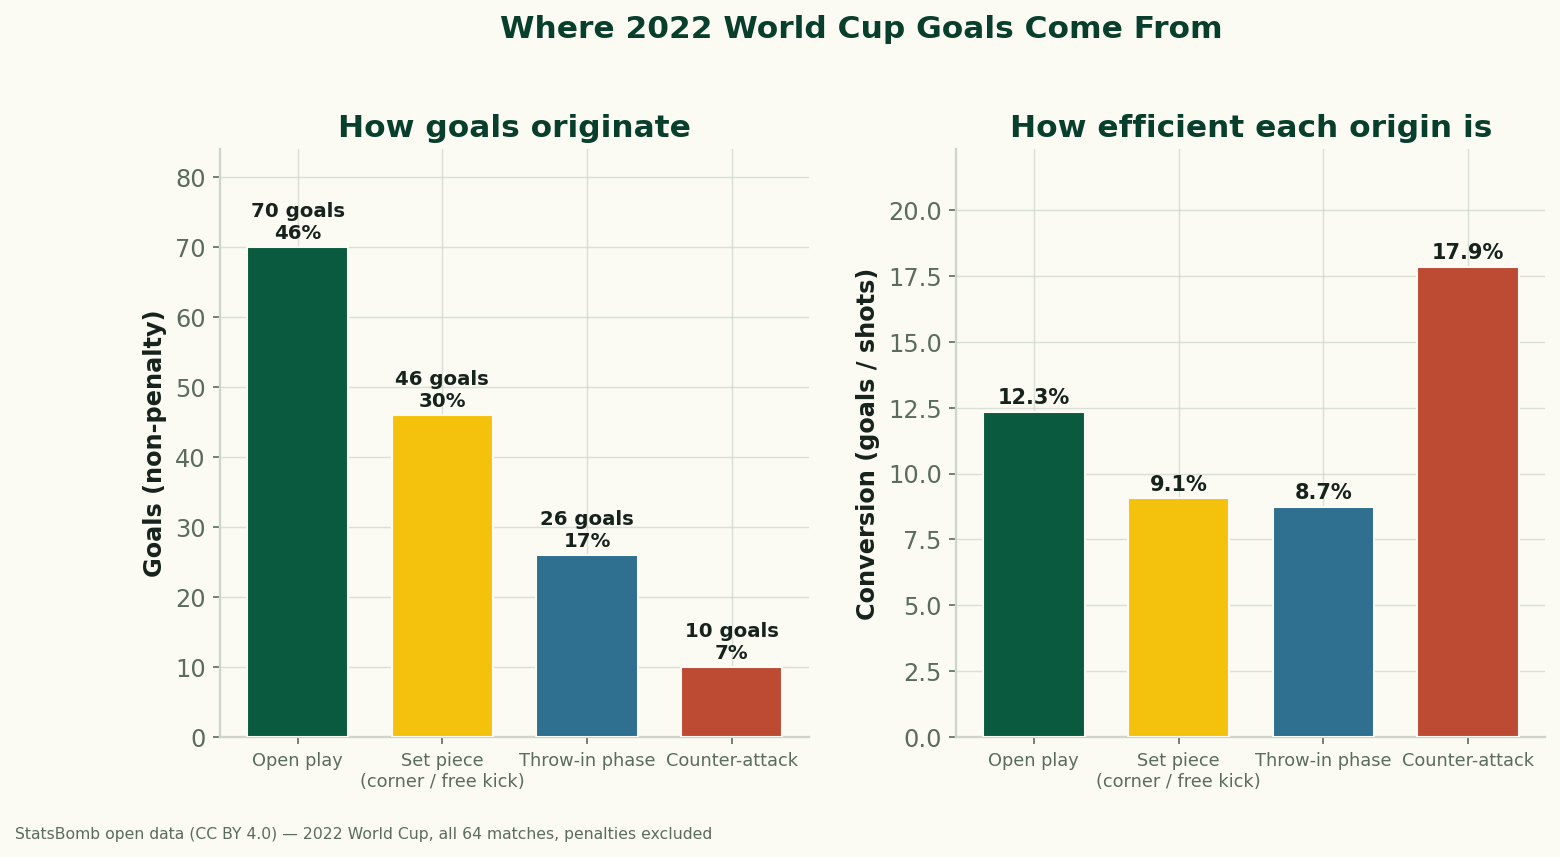
Set Pieces, Open Play, and Counters: Where 2022 World Cup Goals Came From
Using StatsBomb's data for all 64 matches of the 2022 World Cup, we trace every goal back to how the possession began. Set pieces (corners and free kicks) originated 30% of non-penalty goals; open play 46%; and counter-attacks, though rare, converted at 17.9% — nearly double the open-play rate. Where goals really come from.