What Actually Happens to a World Cup Shot
Only one shot in three even reaches the goalkeeper. The most common outcome is missing the goal, and distance decides which fate a shot meets.
A shot count is the most over-read number in football. Eighteen shots to six sounds like a siege, and broadcasters read it out like a verdict. But most shots are not efforts on goal in any meaningful sense — they are blocked in a forest of legs, or dragged wide, or ballooned over. Run every open-play shot from the 2022 World Cup through StatsBomb's event data and the truth is deflating: of 1,430 non-penalty shots, only 488 — 34% — ever forced the goalkeeper to make a save or pick the ball out of his net. The other two-thirds died before they got there. The single most common thing that happens to a World Cup shot is that it misses the goal.
Sourcing. Every figure below is computed from StatsBomb's free, public 2022 World Cup data — all 64 matches, every shot tagged with an outcome, an xG value, and a pitch location. Penalties are excluded throughout (they are a different act). Nothing is invented or remembered; the counts come straight from the file.
The exhibit: where 1,430 shots ended up
| Outcome | Shots | Share | Avg xG | Avg distance |
|---|---|---|---|---|
| Off target (wide/over) | 530 | 37.1% | 0.079 | 18.5 yd |
| Blocked | 379 | 26.5% | 0.054 | 20.4 yd |
| Saved | 336 | 23.5% | 0.097 | 19.2 yd |
| Goal | 152 | 10.6% | 0.257 | 12.3 yd |
| Hit post/bar | 33 | 2.3% | 0.124 | 16.3 yd |
Real values from StatsBomb Open Data, 2022 World Cup, 1,430 open-play shots. Distance is measured from the shot location to the centre of the goal on StatsBomb's 120×80 pitch, where the penalty spot sits 12 yards out. Data provided by StatsBomb.
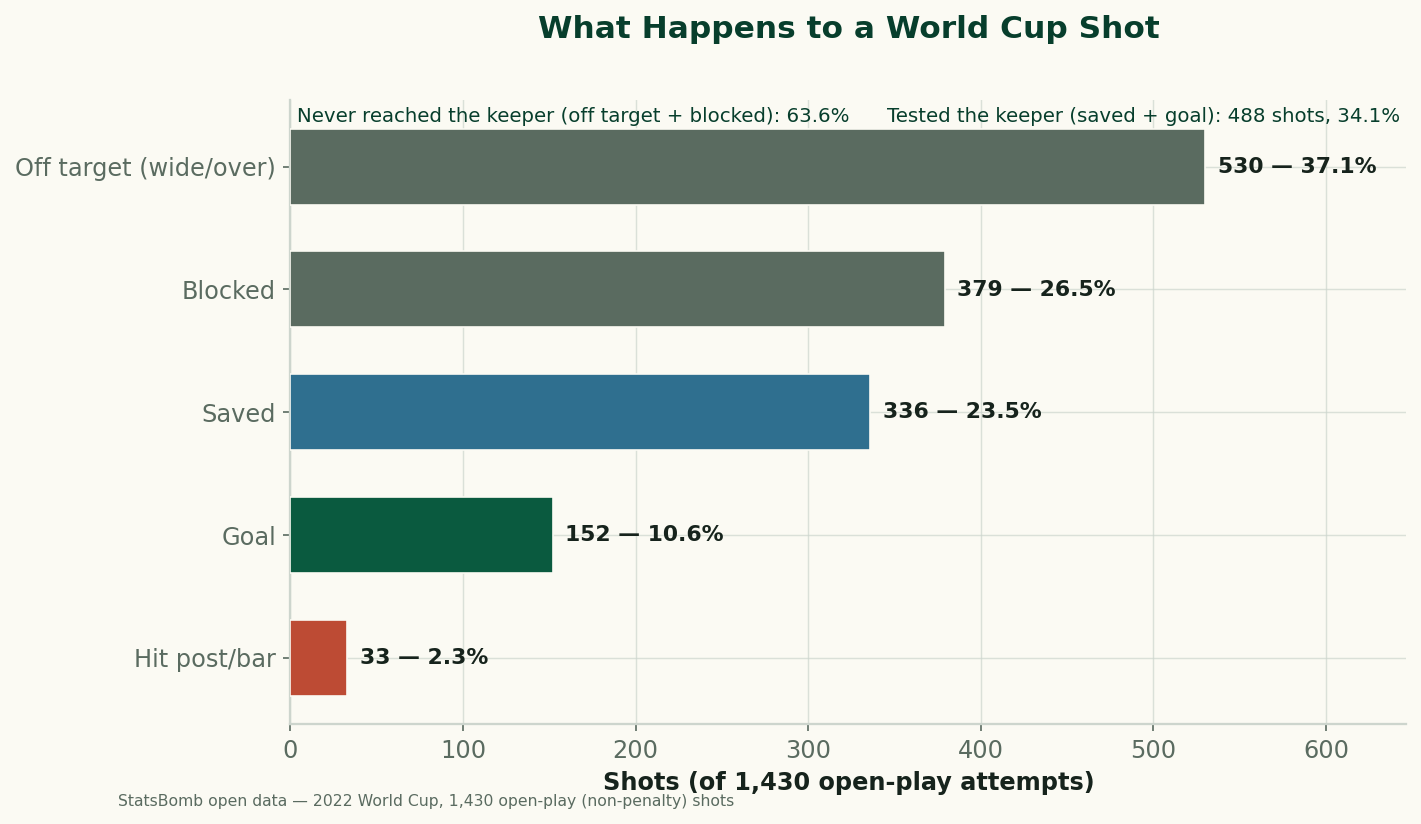
Read the table top to bottom and the hierarchy of a shot's life becomes clear. The largest single category is not a goal or a save — it is missing the target, 37% of everything. Add the blocked shots and you get 63.6% of all attempts that never reached the goalkeeper at all. Only the saved shots and the goals, 34% between them, actually tested the man in gloves. The two-to-six shot count that looked like a siege was, in all likelihood, one team getting a handful of blocks and skied efforts.
The finding: distance decides which fate a shot meets
The most useful column in that table is the last one. Look at the average distance from goal for each outcome and a clean gradient appears. Goals came from an average of 12.3 yards — essentially penalty-spot range. Everything that failed came from farther out: saved shots from 19.2 yards, off-target efforts from 18.5, and blocked shots from the farthest of all, 20.4 yards. A shot's outcome is written largely by where it is taken before the ball is even struck.
The blocked figure is the one worth sitting with, because it runs against intuition. You might assume shots get blocked because a striker is crowded in close, surrounded by defenders in the six-yard box. The data says the opposite: blocked shots came from farther out than any other kind. The reason is geometry. Shoot from 20 yards and there is a wall of bodies between you and the goal — defenders, teammates, a retreating midfield — and the ball has to travel through all of it. Shoot from eight yards and you are usually past the last line, with a clear sight of the net. Distance is what puts legs in the way, and distance is what drags the ball wide. The corollary is the whole case for patience in the final third: the closer you get before you pull the trigger, the more of these dead-end outcomes you skip past entirely.
A worked example: the "siege" that wasn't
Imagine the classic line: "Team A had 20 shots to Team B's 6 and somehow lost." Apply the tournament's own base rates. Of 20 open-play shots, you would expect roughly seven to be off target, five blocked, five saved, and only two or three to be genuinely dangerous enough to go in on an average day. Of the six shots at the other end, if two came from twelve yards in the centre of the box, that team may have created the better chances despite being outshot three to one. This is exactly the "smash-and-grab" pattern you can see on a shot map, and it is why xG exists: it strips out the blocked-and-skied filler and weights each attempt by how likely it actually was to score. The average goal here carried 0.257 xG; the average blocked shot, 0.054 — nearly five times less. Counting them equally is how you misread a match.
What this means for watching
Three practical habits fall out of the table. First, discount raw shot totals hard — roughly two in three are not really tests of the keeper, so a big number can be almost pure noise. Second, when you see "shots on target," remember that is the honest denominator for goalkeeping: here the keepers faced 336 saves and 152 goals, so the tournament-wide save rate on open-play shots on target was about 69%, which is the baseline against which a standout shot-stopping performance should be judged. Third, watch where the shots come from, not how many there are. A team piling up efforts from 20 yards is generating blocks and goal kicks; a team getting to twelve yards is generating goals.
The honest caveats
- Outcome is not the same as chance quality. A blocked shot from a great position was still a great chance that a defender happened to reach; the outcome label describes the ending, not the opportunity. That is precisely why xG is in the table alongside the outcome — the two answer different questions.
- Distance is only part of the story. Angle, pressure, and the number of defenders between ball and goal all matter, and averaging distance flattens them. Two shots from 18 yards can be worlds apart in danger.
- Open play only. Excluding penalties is the right call for judging shooting, but it means these shares describe attempts from the run of play, not a team's total goal output.
- "Saved" bundles the easy and the miraculous. A routine gather and a fingertip stop onto the bar both count as one save here; separating them needs post-shot xG, which models where in the goal-mouth the ball was heading.
The takeaway
A shot is not a moment of danger; it is a lottery ticket whose odds were mostly set the instant it left the boot. At the 2022 World Cup, only one open-play shot in three even reached the goalkeeper, the most common single outcome was missing the goal, and the shots that failed came from four to eight yards farther out than the ones that scored. The next time a scoreline gets explained by a shot count, remember that most of those shots were bodies and fresh air. If you want to know who actually threatened, count the ones from twelve yards — or just read the map of where goals come from, because it is almost one place.
Reproduce it
From data_layer/wc2022_shots.json, drop penalties, then group the remaining 1,430 shots by their outcome field, and for each group count the shots, average the xg, and average the straight-line distance from (x, y) to the goal centre at (120, 40). No network at build time, nothing hand-entered.
Sources & further reading
- Shot, outcome & xG data: StatsBomb open data (free public dataset; attribution required), FIFA World Cup 2022, all 64 matches, bundled as
data_layer/wc2022_shots.json. Data provided by StatsBomb. - Companion: where goals are scored from and how to read a shot map.
- Background: expected goals explained · post-shot xG & goalkeeping · World Cup shot-stopping.
More from Data Deep-Dives
Does Europe Cost English Clubs at the Weekend? Three Seasons Can't Find It
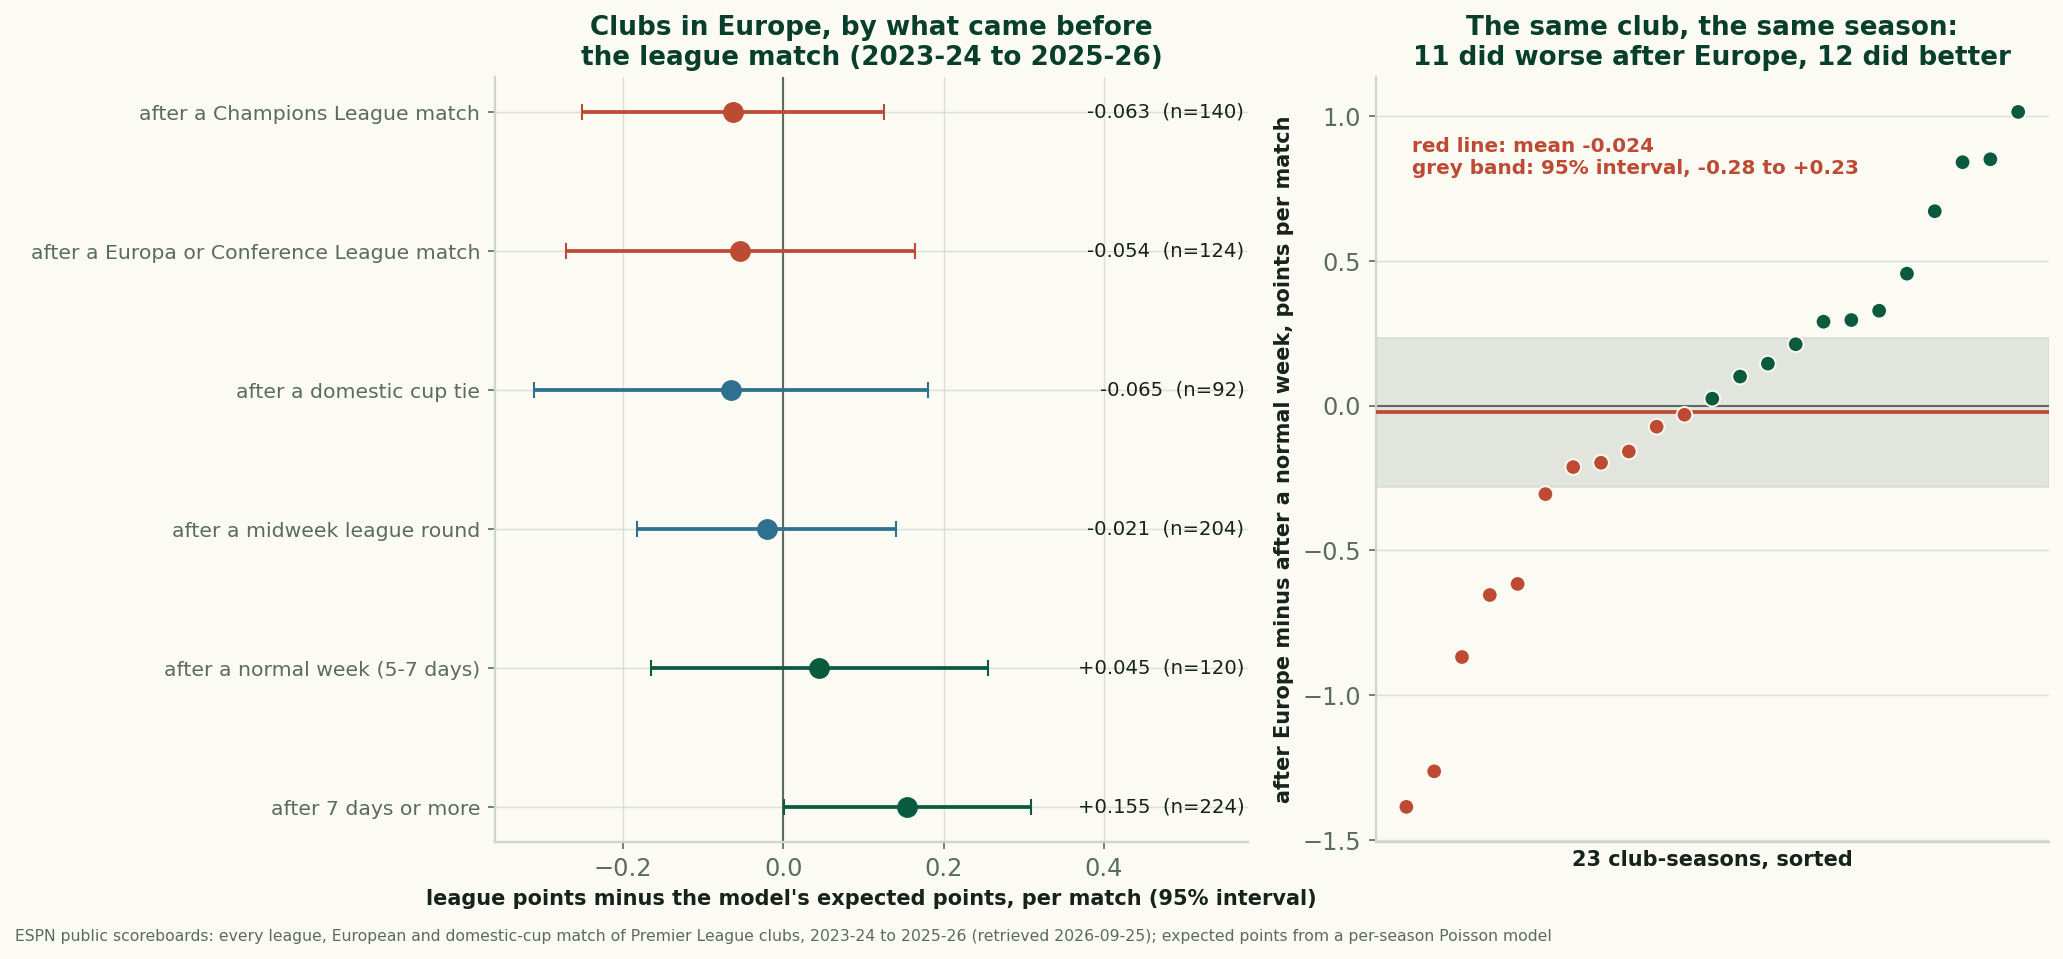
After a European night, English clubs took 1.56 league points a match against 1.62 expected. Within the same club and season the gap is -0.024: not measurable.
Manchester United Lead the League in Shots and Sit Twelfth
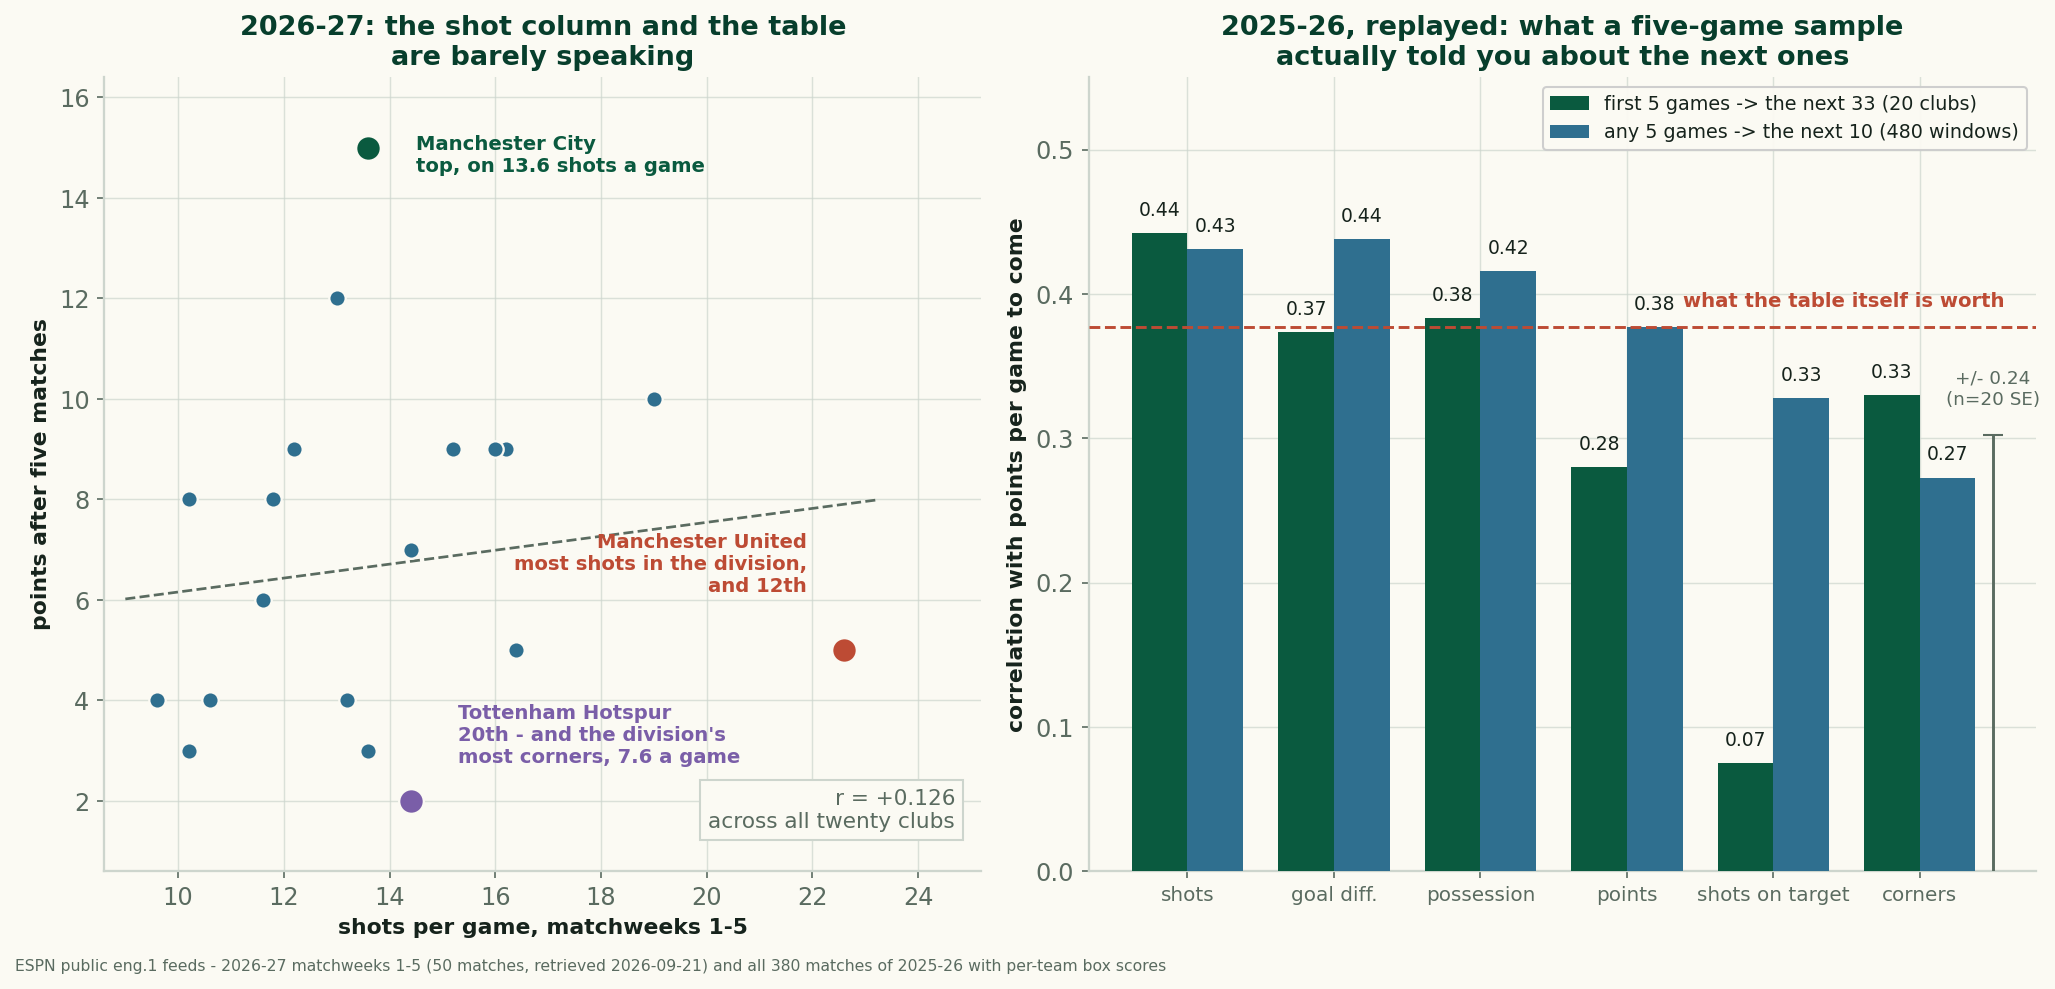
United take 22.6 shots a game and have 5 points. Across 2025-26, a club's five-game shot count predicted its next results better than its points did.
Home Advantage Didn't Die. The Results Column Can't See It
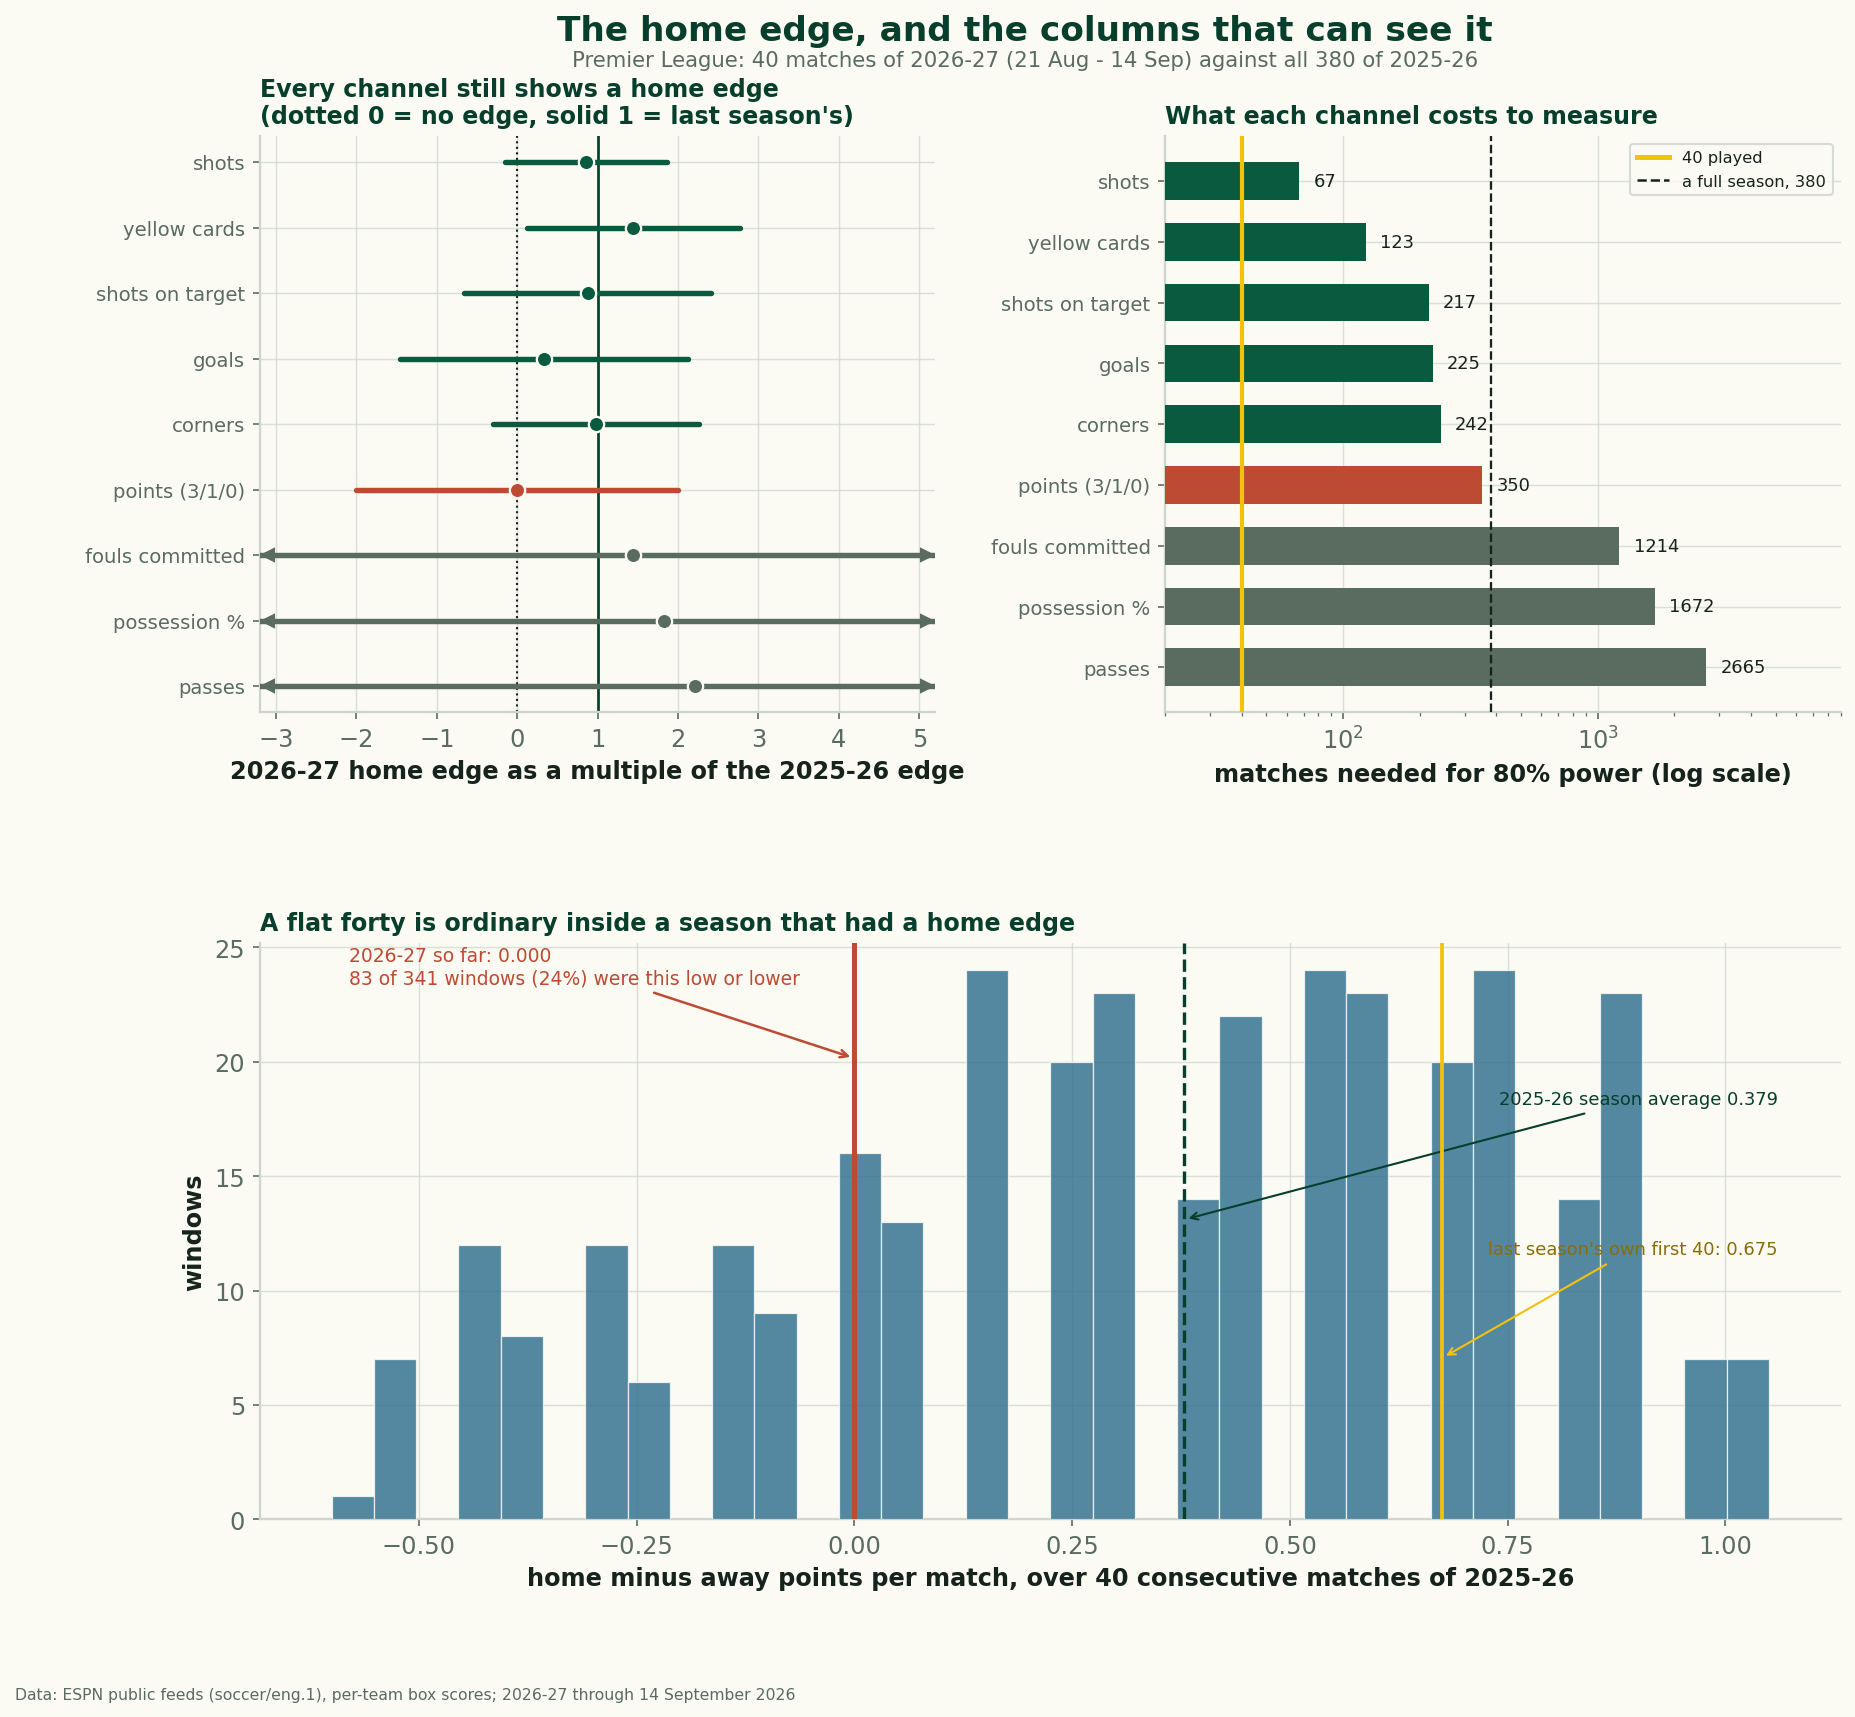
Home and away split the first 40 matches of 2026-27 evenly, yet the shot, corner and card columns keep the home edge. Plus a decade of home-advantage data.