Home Advantage Didn't Die. The Results Column Can't See It
Home teams have won thirteen of the first forty and lost thirteen. That is the one column in the box score too noisy to read after forty matches, so we read the other eight instead — and they all still say the same thing.
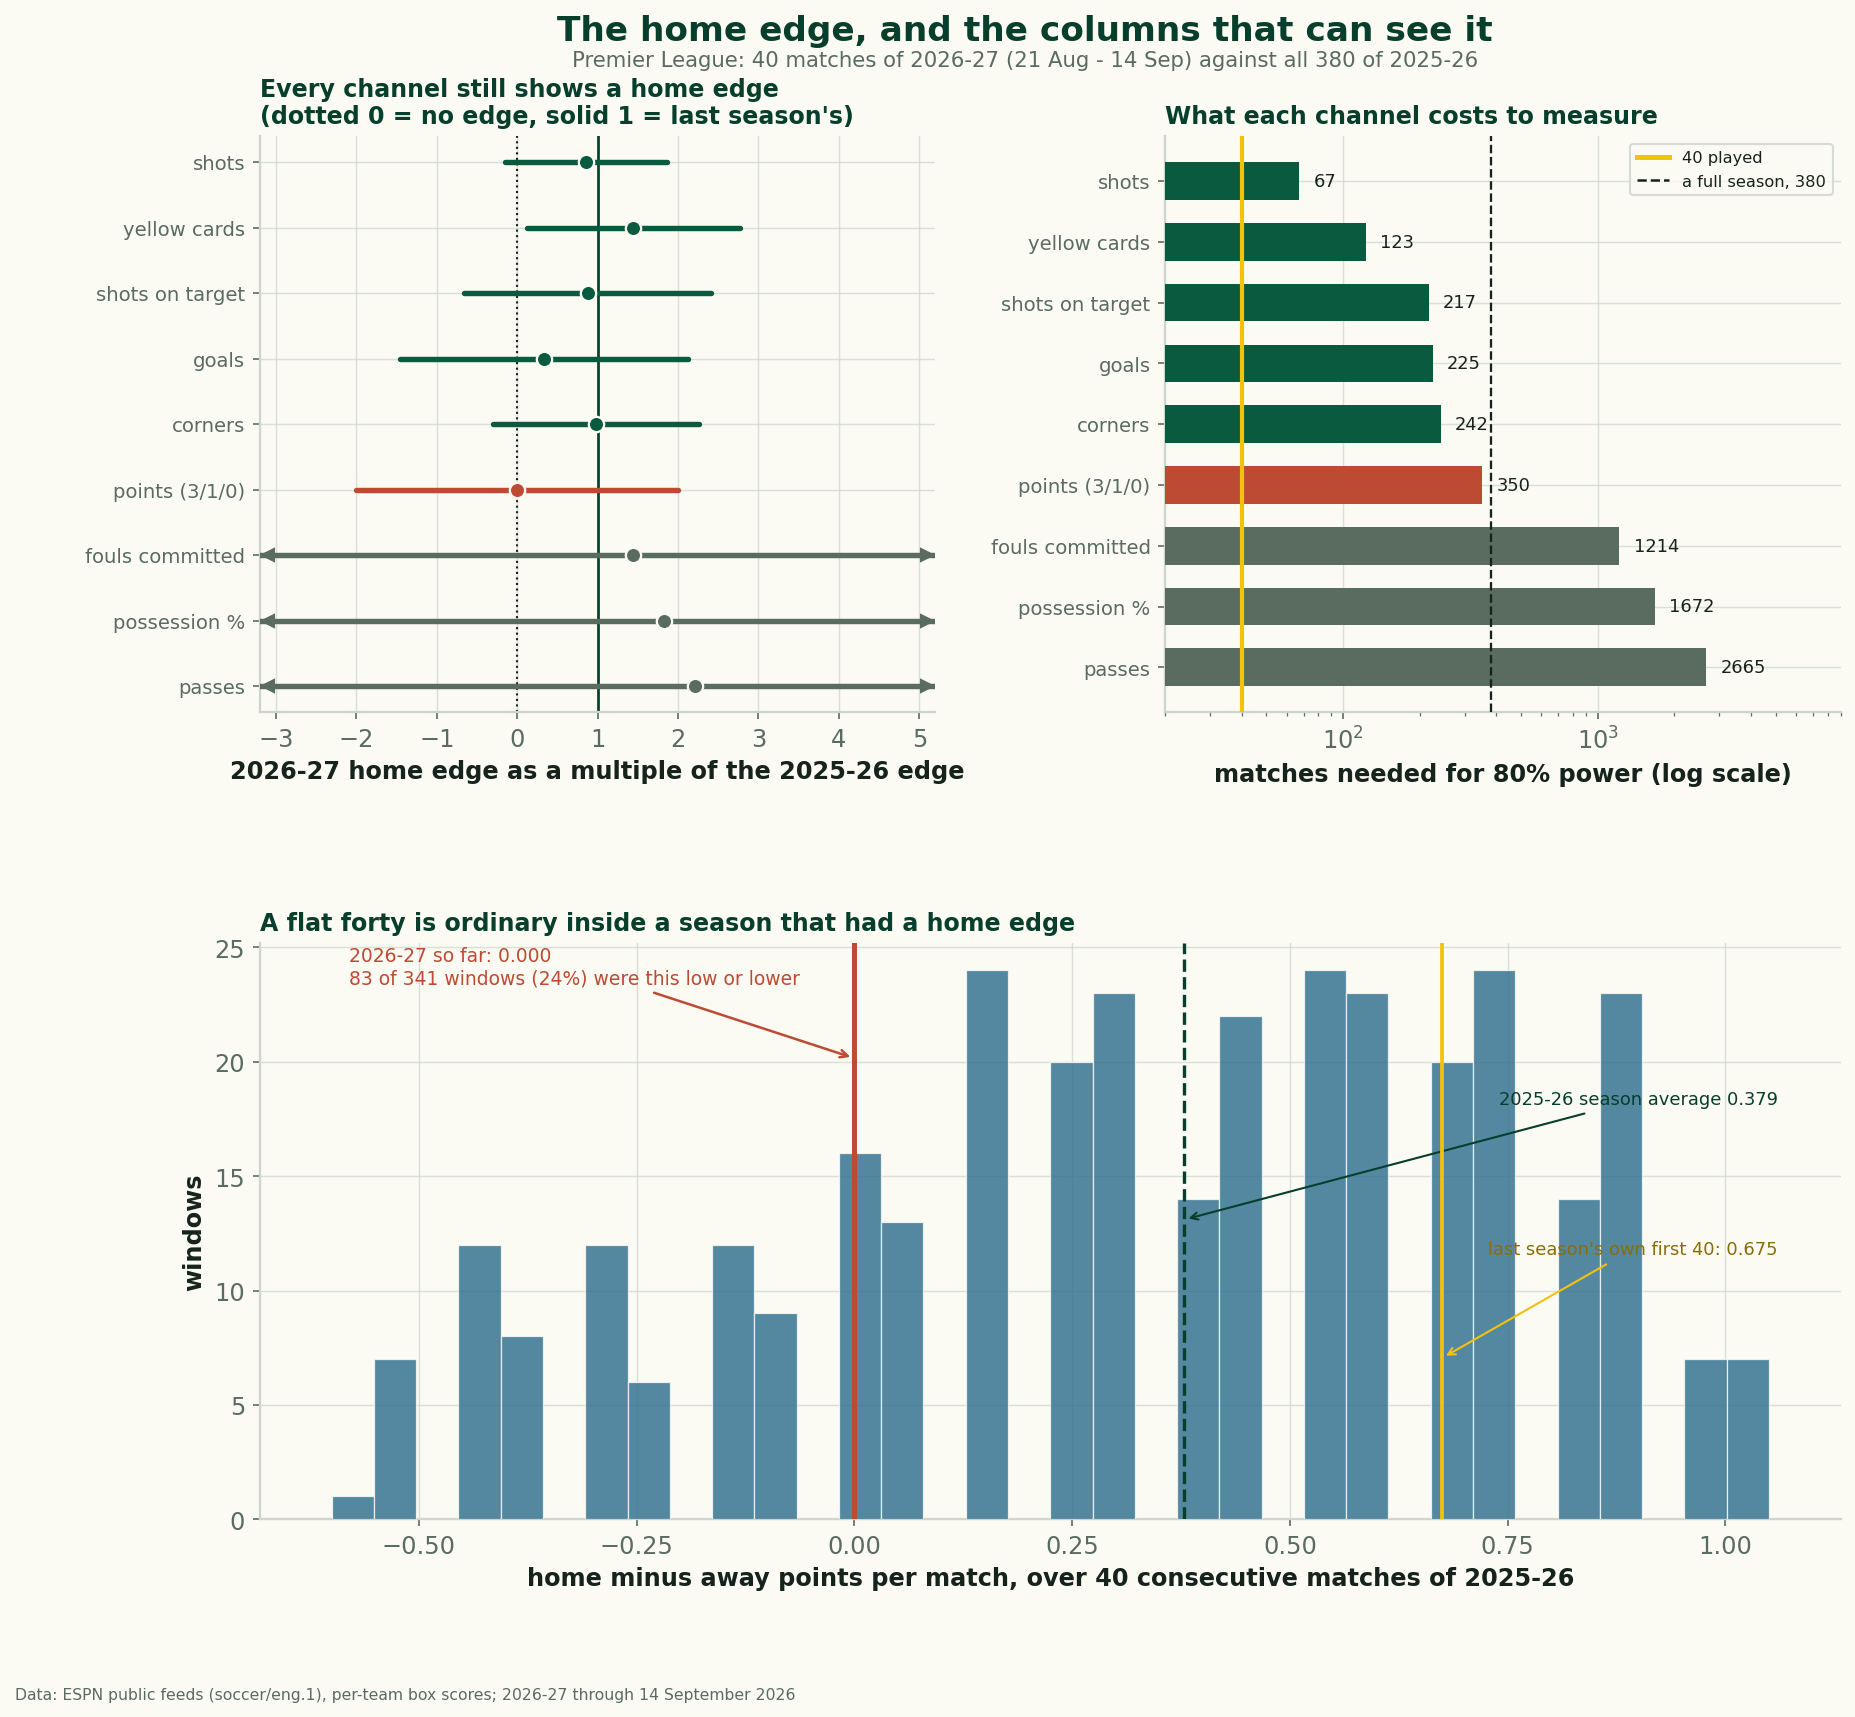
Through four matchweeks of the 2026-27 Premier League, home teams have won 13 matches, drawn 14 and lost 13. The home side's advantage in points per match is exactly 0.000, against +0.379 across all 380 games of last season. That is the sentence the table invites this week, and it is worth almost nothing, because the points column is the least sensitive instrument in the box score: on last season's numbers it takes 350 matches — nine tenths of a season — before a test can reliably see a home edge that size. Forty cannot. The other eight columns in the same box score are far quieter, and every one of them still shows a home edge: home sides are out-shooting the away side by 2.30 a match (last season, 2.68), out-cornering them by 0.78 (0.79), taking 0.55 more shots on target (0.63) and collecting 0.60 fewer yellow cards (0.42). Not one of those has moved by as much as a quarter of a standard error. The home edge has not gone anywhere. It has stopped converting.
Sourcing. Two datasets, no models, no expected goals. The yardstick is last season — all 380 matches of 2025-26 with ESPN's per-team box scores, 380 of 380 summaries, none missing, served at data_layer/epl_2025_26_boxscores.json — because that season demonstrably had a home advantage. This season is ESPN's public eng.1 scoreboard and summary feeds, completed matches only, re-pulled by data_layer/refresh_epl.py before every build and served at /data/epl_2026_27_results.json (50 completed matches as of 25 September 2026). This piece reads a fixed window of it: the 40 matches played 21 August to 14 September 2026, matchweeks one to four, every club exactly four games. Matchweek five opened at Brentford on the evening of 18 September, after the pull, and is excluded by date, so nothing below is a live or part-played result. All 133 figures are recomputed by charts/chart_epl_home_edge_power.py, which exits non-zero if any of them stops reproducing.
Nine channels, one question
Every match produces one home-minus-away difference in every statistic the provider publishes. The home edge in a channel is the average of those differences; how precisely you know it is their spread divided by the square root of the match count. That second half is the part nobody quotes, and it is why the same forty matches measure some columns well and others not at all.
Last season, per match, home sides took 2.68 more shots, 0.63 more on target, won 0.79 more corners, had 1.46 percentage points more of the ball, played 10.4 more passes, committed 0.35 fewer fouls, received 0.42 fewer yellow cards, scored 0.30 more goals and took 0.379 more points. Every one is a real, positive home edge. But their noise varies enormously. The per-match spread of the points difference is 2.53, because that difference can only be +3, 0 or −3; the spread of the shot difference is 7.83 around a far larger effect. Divide effect by noise and the shot channel is roughly five times the instrument the points channel is.
The results column needs most of a season
Put a number on it. To detect an effect of size d with per-match spread s, at 80% power and the conventional two-sided 5% threshold, you need about n = ((1.96 + 0.84) s / d)2 matches. Feed last season's own figures in, channel by channel, and you get the right-hand panel above: shots need 67 matches, yellow cards 123, shots on target 217, goals 225, corners 242 — and points need 350, or 0.92 of a season. Fouls need 1,214, possession 1,672 and passes 2,665, which is to say those three cannot be measured at this level inside a season at all.
Forty matches have been played. Exactly one channel is properly measurable on a sample that size, and it is the shot count. The column everyone is reading is the sixth-best of the nine, and it needs almost nine times the data available.
What the other eight say
So read them. The 2026-27 home edge, with last season's in brackets: shots +2.30 (+2.68), shots on target +0.55 (+0.63), corners +0.78 (+0.79), possession +2.68 points (+1.46), passes +23.0 (+10.4), fouls −0.50 (−0.35), yellow cards −0.60 (−0.42), goals +0.10 (+0.30), points 0.000 (+0.379).
Test each against last season and nothing has changed: the largest move in any of the nine, in standard errors of the difference, is the points column itself at −0.93, with shots, on-target and corners at −0.26, −0.15 and −0.03. And the one channel whose 2026-27 edge is individually distinguishable from zero on forty matches is the discipline one, with away sides taking 0.60 more yellows a match, 2.13 standard errors clear of nothing. That is not our finding: the discipline piece established the away booking premium on this feed a fortnight ago, at last season's magnitude. It is the mechanism the home-advantage explainer named as the best-evidenced of the four, showing up intact while the scoreboard says the edge is gone.
One more, because it is the cleanest of the lot. Home teams out-shot their opponent in 25 of the 40 matches, 62.5%. Last season, across 380: 62.6%. Territorially this is the same league it was in May.
Worked: what it would take to call it dead
Suppose you wanted to establish that home advantage really has vanished. The arithmetic, end to end:
- The quantity is home points per match minus away points per match. The two sides are identical here by construction of the results: 13 home wins and 13 away wins, 14 draws shared. Home sides have (3×13) + 14 = 53 points from 40 matches, or 1.325 each; away sides have the same 53. The difference is 0.000, exact rather than rounded.
- Those per-match differences have a standard deviation of 2.45, so the standard error on the average is 2.45 ÷ √40 = 0.387.
- The 95% interval therefore runs from −0.76 to +0.76 points per match. Last season's +0.379 sits comfortably inside it. So does an edge twice that size, and so does one of the same size in the away team's favour.
- The half-width of that interval is 2.0 times the entire effect under discussion. A measurement whose error bars are twice the thing being measured is not evidence of absence.
- To narrow it enough to rule last season's edge out, at 80% power: ((1.96 + 0.84) × 2.53 ÷ 0.379)2 = 350 matches. Come back in late April.
The one thing that did move
There is a real change in this data, and it is not in the shot counts. Home sides have taken 186 shots on target and scored 59, a conversion rate of 31.7%. Away sides have taken 164 and scored 55, a rate of 33.5%. Last season the same split ran the other way: 33.9% at home against 31.6% away.
Price it. Apply last season's venue-specific rates to this season's volumes and the home teams' 186 on-target attempts are worth 63.0 goals against the away teams' 51.8 — a goal difference of +11.2 to the home side. The actual figure is +4. The entire missing home advantage, seven goals across forty matches, sits in the conversion rates, on shot volumes that have not changed.
Which is where we stop, because Monday's piece was about exactly this quantity and found it has no memory: last season a club's finishing and saving rates over nineteen games correlated −0.21 with its rates over the next nineteen, while its share of the shots on target carried over at 0.76. Volumes persist; rates do not. The home-away split is that fact seen from another angle — the channel that vanished is the one that never stays.
A flat forty is an ordinary forty
The last check needs no theory. Take last season, which had an unambiguous home advantage, and slide a 40-match window along it. There are 341 such windows. Their home-minus-away points difference averages 0.338 and ranges from −0.600 to +1.050, and 83 of them, 24.3%, came in at or below the 0.000 this season is sitting on. Counting home wins instead: the windows average 16.8, run from 10 to 24, and 70 (20.5%) had 13 or fewer, which is this season's tally.
The formal versions agree. At last season's home-win rate of 42.6%, the chance of 13 or fewer home wins in 40 matches is 0.127, against an expected 17.1. Resampling 40 of last season's matches 20,000 times, 18.4% of draws produced a home edge of zero or worse. And last season's own opening 40, from 15 August to 14 September 2025, produced 20 home wins and an edge of +0.675 — nearly double the season it belonged to. Forty-match windows swing this hard in both directions inside one season.
The temptation to read a trend anyway is strong, because the matchweeks line up so neatly: home records of 7-1-2, then 3-3-4, then 2-6-2, then 1-4-5. That is a monotone decline across four rounds, it is ten matches a step, and we are not going to read it. Four points in a row will trend in some direction about half the time.
What this cannot tell you
- Absence of evidence. Nothing here shows the home edge is intact in the results; it shows the results cannot currently tell. If home advantage had genuinely halved, this data would look about like this — and so would a season in which nothing changed. Both stay live until roughly April.
- Measurable is not important. Shots and corners are readable early precisely because they are frequent, and frequent events are cheap. A home edge in shots that stops producing one in points is a smaller thing than it sounds. The reliability piece makes the neighbouring point about clubs — though it answers a different question, how fast a club's numbers settle, where this asks how many matches a league-wide contrast needs. Neither figure transfers to the other.
- Game state contaminates the territorial columns. A team that goes behind shoots more, so if home sides are drawing and losing more often, some of their shot edge is chasing rather than superiority. The game-state piece covers why; separating it needs minute-level data this feed lacks.
- The fixtures are not balanced. Four rounds is not a schedule in which everyone has hosted a fair cross-section, and the fixture-difficulty piece found the opening rounds are strongly tilted by draw. A home-away contrast is more robust to this than the table, since every match contributes one of each, but it is not immune.
- Shot quality is missing, and so is a second season. A shot on target is one event whether it is a tap-in or a 25-yard drive, per Opta's definition; if home sides are taking worse shots, the conversion gap is real rather than noise, and this feed cannot see the difference. Penalties and own goals sit inside the goal counts, and every baseline here is one season through one provider.
Reproduce it
Both files are served, so none of this rests on trust. For each match take the home-minus-away difference in points (3/1/0), goals, shots, shots on target, corners, possession, passes, fouls and yellow cards. The home edge is the mean of those differences, its standard error the sample standard deviation over the square root of the match count, its 95% interval the mean plus or minus 1.96 standard errors. Matches-needed is ((1.96 + 0.84) × s / d)2 with s and d from 2025-26. The window test slides a 40-match window along last season in date order, scoring all 341 positions; the resample draws 40 of last season's matches without replacement, 20,000 times, under a fixed seed.
The running season is on the 2026-27 tracker, which updates itself after every round. A rule for the next two months: when a league-wide rate looks like it has collapsed, check how many matches it would take to notice before checking whether it has.
Sources & further reading
- 2025-26 box scores, all 380 matches:
data_layer/epl_2025_26_boxscores.json, pulled from ESPN's public summary feed bybuild_epl_2025_boxscores.py. - 2026-27 results and box scores: ESPN’s public scoreboard and summary feeds for eng.1, completed matches only, pulled by
data_layer/refresh_epl.pyand served at/data/epl_2026_27_results.json(50 completed matches as of 2026-09-25; this piece reads the 2026-08-21 to 2026-09-14 window, 40 matches). - The shots-on-target definition: Opta event definitions, Stats Perform.
- The long-run size of the home edge and the four mechanisms proposed for it: Home Advantage, Quantified, built on StatsBomb open data.
- Referee bias under crowd pressure, the mechanism the card column tracks: L. Garicano, I. Palacios-Huerta and C. Prendergast, “Favoritism Under Social Pressure”, Review of Economics and Statistics 87(2), 2005, on injury time awarded to trailing home sides; and A. M. Nevill, N. J. Balmer and A. M. Williams, “The influence of crowd noise and experience upon refereeing decisions in football”, Psychology of Sport and Exercise 3(4), 2002, in which referees shown the same incidents with crowd noise called fewer fouls against the home team.
- The away booking premium, measured first: The Whistle Is Busier and the Cards Are Not. Why conversion rates are the channel that does not persist: Finishing and Saving Rates Have No Memory.
- How quickly each column settles at club level: Three Games Tell You How a Team Plays, Not How Good It Is; the table's own convergence, The Table Lies Until October; why the scoreline must be known first, Game State and Score Effects; and the opening-fixture tilt, Schedule Strength Is Real.
- Reproduction: the two datasets above plus the recipe in “Reproduce it”, all 133 figures recomputed by
charts/chart_epl_home_edge_power.pyat build time.
Home advantage, quantified: a decade of data
This section was first published on 26 May 2026 as a separate article.
The phrase "home advantage" is used so casually it has almost stopped meaning anything. Pundits invoke it as an afterthought; broadcasters mention it while filling airtime before kick-off. But it is a real, quantifiable effect — and when you actually run the numbers on a large sample of matches, you find that the size, the shape, and perhaps the trend of that edge are more interesting than the cliché suggests.
The numbers, straight
Across 3,425 domestic-league matches in the StatsBomb open-data corpus, the home side won 44.4% of the time. Draw rate was 22.2%. The away side won the remaining 33.4%. That is not a small gap: the home team wins about a third more often than the visitor. On a basic points-per-game basis, the home side earns 1.55 PPG — a comfortable mid-table return without ever leaving your own stadium.
Goals tell the same story more granularly. The home team scores 1.62 goals per match on average; the away team scores 1.31. That 0.31-goal differential per game compounds across a season into something structurally decisive — it is roughly the difference between a team with genuine title credentials and one fighting to avoid the drop.
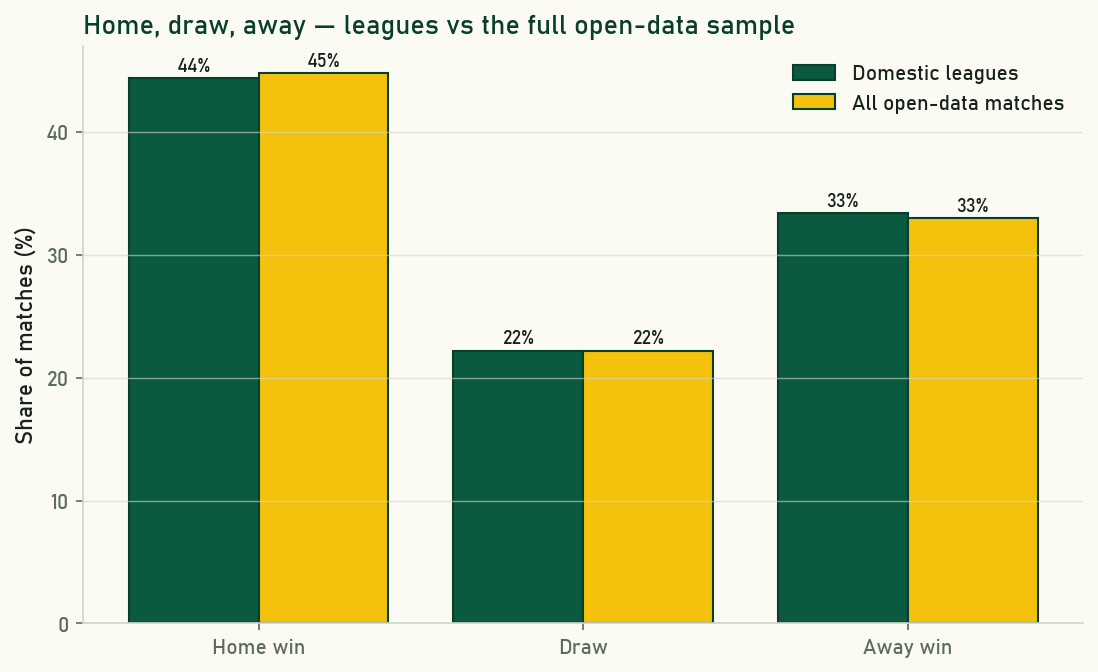
When neutral-venue tournament matches are folded into the sample — bringing the total to 3,961 matches across 24 competitions — the home-win figure edges up to 44.8%. That is worth pausing on: adding matches where one side is designated "home" at a neutral ground nudges the rate slightly upward rather than diluting it. It suggests the open-data sample's tournament designation leans toward seeded or historically dominant sides, and it is a good reminder that corpus composition matters. The domestic-league figure of 44.4% is the cleaner, more interpretable number.
| Sample | Matches | Home win % | Draw % | Away win % |
|---|---|---|---|---|
| Domestic leagues | 3,425 | 44.4 | 22.2 | 33.4 |
| All open-data matches | 3,961 | 44.8 | 22.2 | 33.0 |
Four explanations, not all equal
Home advantage is usually explained through four channels. They are not equally evidenced, and collapsing them into one vague "home advantage" effect obscures what is actually driving the numbers.
Travel and fatigue. Away teams travel. Longer trips mean disrupted sleep, tighter preparation windows, and legs that have done more work before the match begins. This effect exists and is directionally sensible — studies of European competition have repeatedly found that trans-continental travel correlates with worse performance. But within a single domestic league, the distances are often modest. Fatigue probably explains a slice of the gap, not the majority of it.
Familiarity with the environment. Home players know their pitch's bounce, the width of the tunnel, the dimensions of the dressing room, the slope they have been training on since pre-season. Away players adapt in warm-up. The effect is real but hard to isolate — it is confounded with everything else happening at the home ground simultaneously.
The crowd. The intuitive explanation, and the one everybody reaches for first. Seventy thousand people cheering every forward pass, whistling every visiting touch, generating the kind of ambient noise that makes communication near-impossible for the away team. The crowd clearly matters — but how much?
Referee bias. This is, to be blunt, the best-evidenced mechanism of the lot. A large body of research going back to the early 2000s has found that referees systematically award more stoppage time when the home team is losing, show more yellow cards to visitors than to hosts in equivalent challenges, and are more likely to award home-team penalties. The direction is consistent across decades and leagues. Nobody thinks referees are deliberately dishonest; the effect is almost certainly unconscious, driven by social pressure from the crowd. But the size of the effect — measurable and robust across thousands of matches — makes it hard to hand-wave away.
The COVID experiment
The most useful natural experiment in the history of home advantage research arrived, grimly, in March 2020. Football leagues across Europe played out their 2019–20 seasons and most of 2020–21 in empty stadiums. For the first time in the sport's history, you could watch a top-flight match with no crowd noise whatsoever, the players' calls to each other echoing off empty concrete.
The results were directionally clear across multiple analyses: home advantage shrank when the crowds disappeared. The effect did not vanish entirely — which is consistent with the travel, familiarity and referee-familiarity mechanisms still operating — but it fell. Without specifying a precise figure (the exact magnitude varied by league, study and sample), the research community found a meaningful reduction that pointed a firm finger at the crowd as a genuine contributor to the effect, not merely a colourful backdrop to it.
What the empty-stadium era could not do was cleanly separate the referee-bias channel from the direct crowd-noise channel on player performance. Referees, presumably, were also affected by the eerie quiet — they had fewer thousands of voices cueing their perceptions. Teasing those threads apart remains an open research question, but the direction of the evidence is not in doubt.
Is the edge shrinking?
Home advantage at the aggregate level has been declining over the long term in most of the major European leagues, at least as measured by pre-pandemic data. The reasons are debated: better sports science for away teams, tactical sophistication that reduces the importance of local familiarity, improved travel logistics, more professional preparation standards across the board. The professionalization of football has, slowly, levelled some of the playing field.
The pandemic dip complicated this trend-line considerably. Home advantage collapsed during the empty-stadium period, then appeared to rebound — and, according to some analyses, partially overshot — as fans returned. Disentangling "long-run structural decline" from "pandemic noise" requires very careful time-series work on data the open corpus does not currently cover in full. The honest reading of the evidence is: the trend is probably downward over decades, but the signal is noisy.
What this sample can and cannot tell you
The StatsBomb open-data corpus is a rich resource and a genuinely large sample — 3,961 matches across 24 competitions — but it carries structural quirks worth naming. It mixes eras: the competitions represented span multiple decades, with varying tactical norms, rules (the back-pass change in 1992, for instance, would alter how home teams conserve leads) and competitive environments. It over-represents showpiece competition: World Cups, Champions League matches, high-profile domestic seasons from the elite leagues. Smaller domestic pyramids, which might show different home-advantage patterns, are mostly absent.
What the corpus tells you confidently is the gross rate — 44.4% home wins in domestic leagues — and the goals differential. What it cannot tell you reliably is whether 2024 looks like 2004, or whether the Bundesliga looks like the Eredivisie. For those questions you would want a purpose-built longitudinal dataset with consistent competition coverage. The macro numbers here should be treated as a robust baseline, not as the final word on every league at every moment.
Still: 44.4% home wins from over three thousand league matches, 1.62 goals scored at home versus 1.31 away. The advantage is real, it is not going to disappear, and it is doing something more interesting than just "the crowd cheering". That seems like a reasonable place to start.
The data behind this piece
- StatsBomb open data — the match-level data underlying all figures in this article.
- StatsBomb — methodology documentation and research notes.
- FBref — season-by-season home/away splits for major European leagues.
- Understat — xG-adjusted home and away performance tables for the top five leagues.
More from Data Deep-Dives
Does Europe Cost English Clubs at the Weekend? Three Seasons Can't Find It
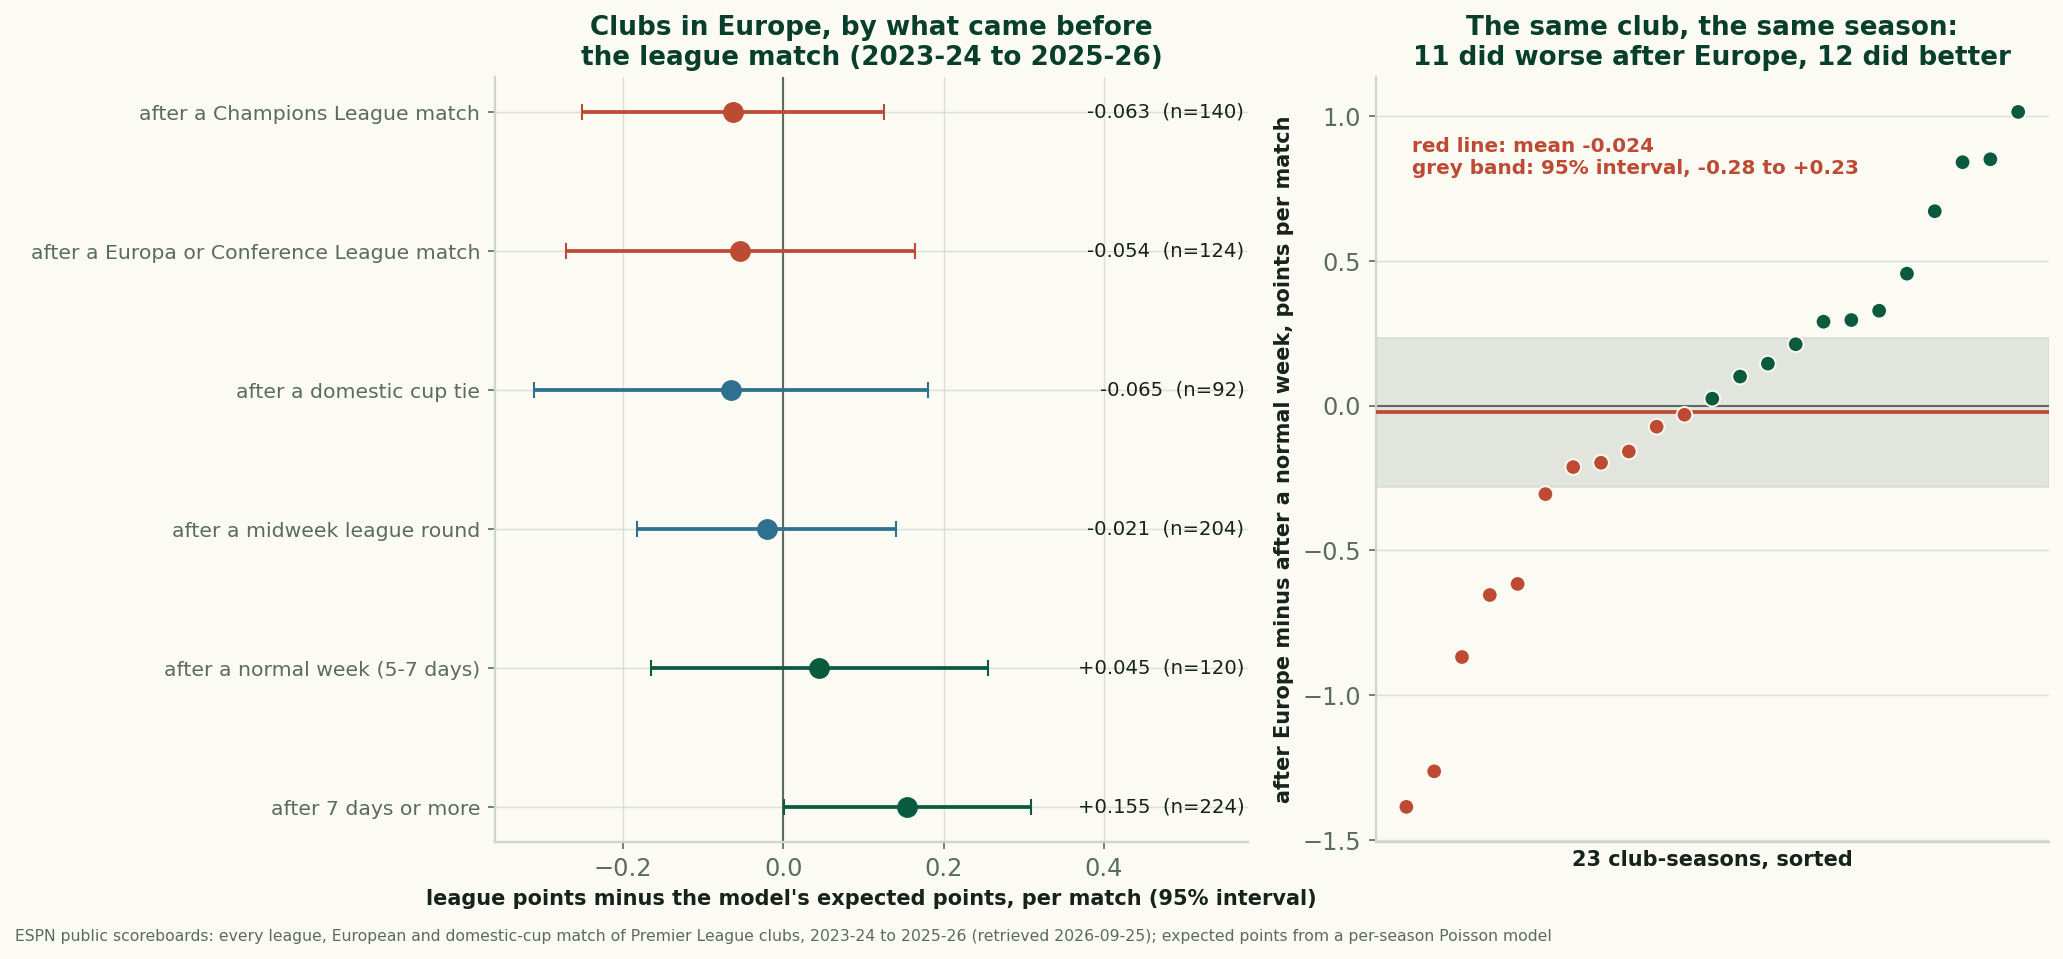
After a European night, English clubs took 1.56 league points a match against 1.62 expected. Within the same club and season the gap is -0.024: not measurable.
Manchester United Lead the League in Shots and Sit Twelfth
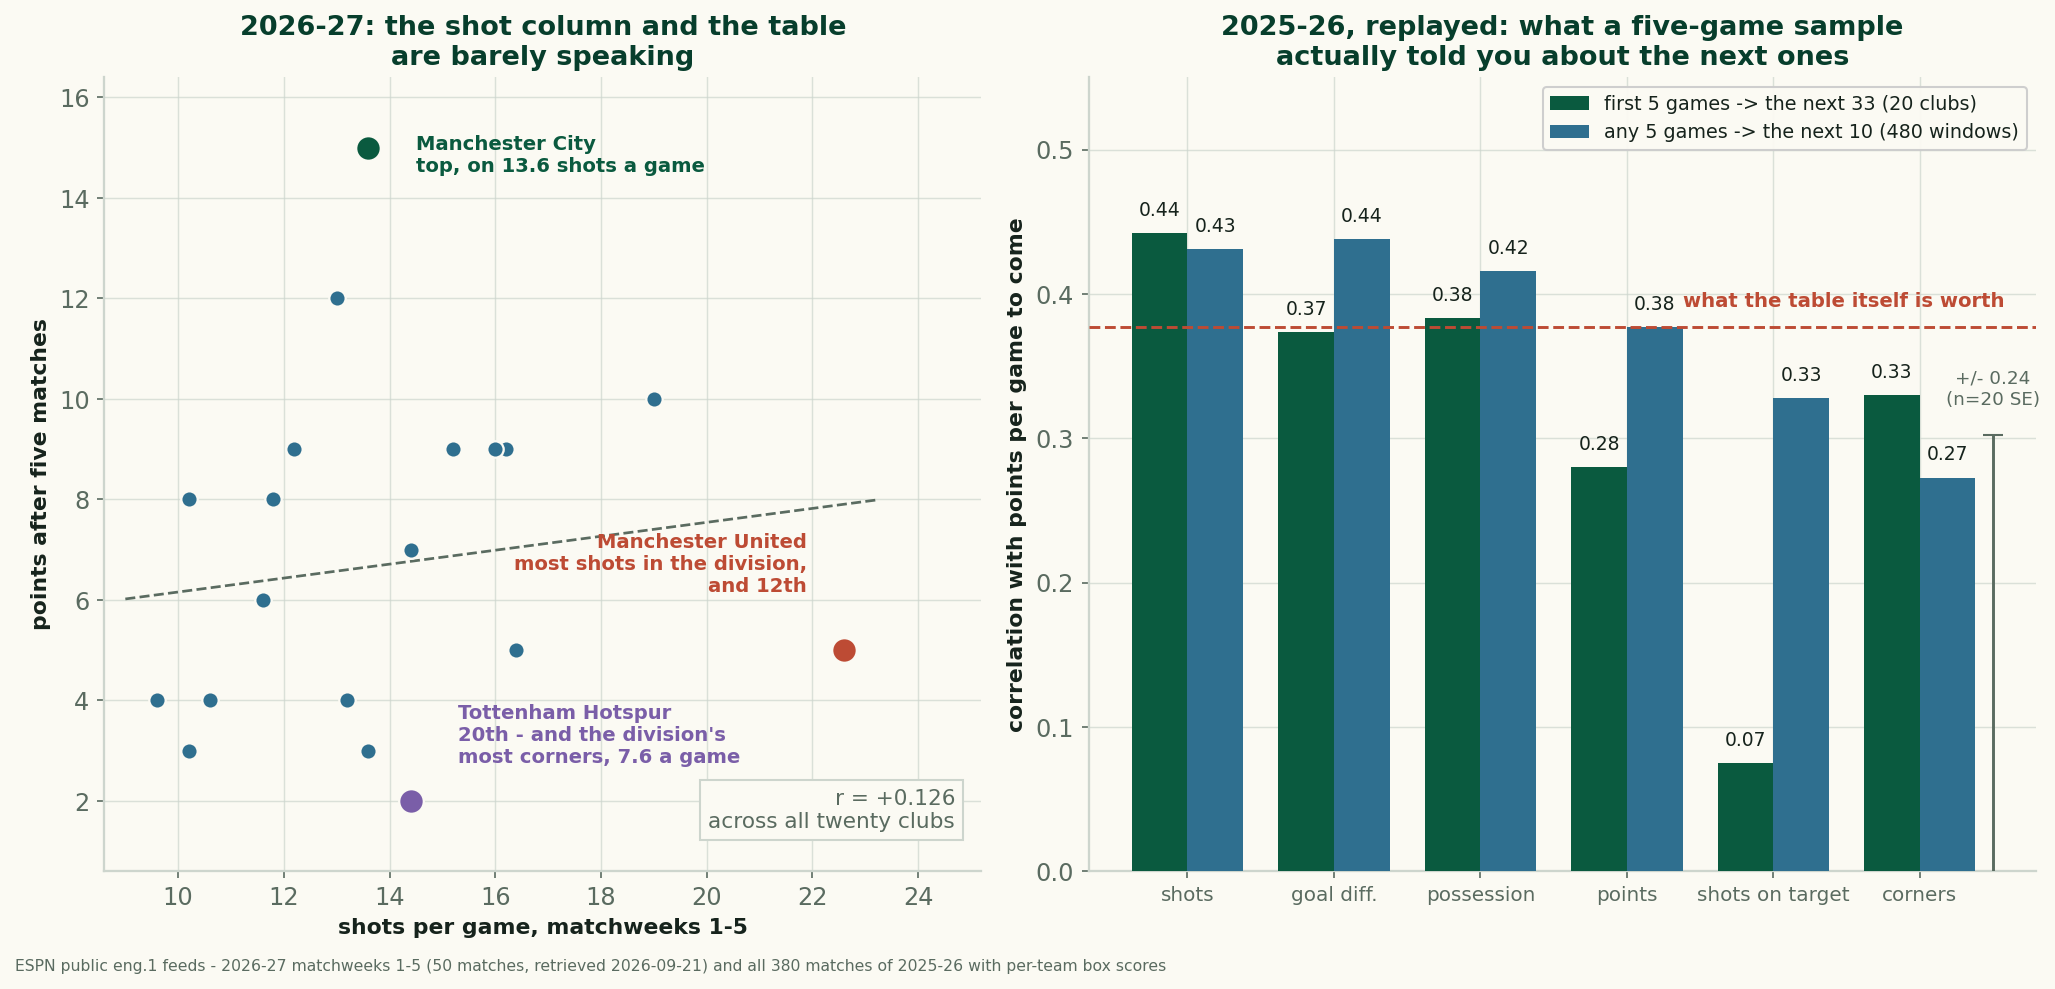
United take 22.6 shots a game and have 5 points. Across 2025-26, a club's five-game shot count predicted its next results better than its points did.
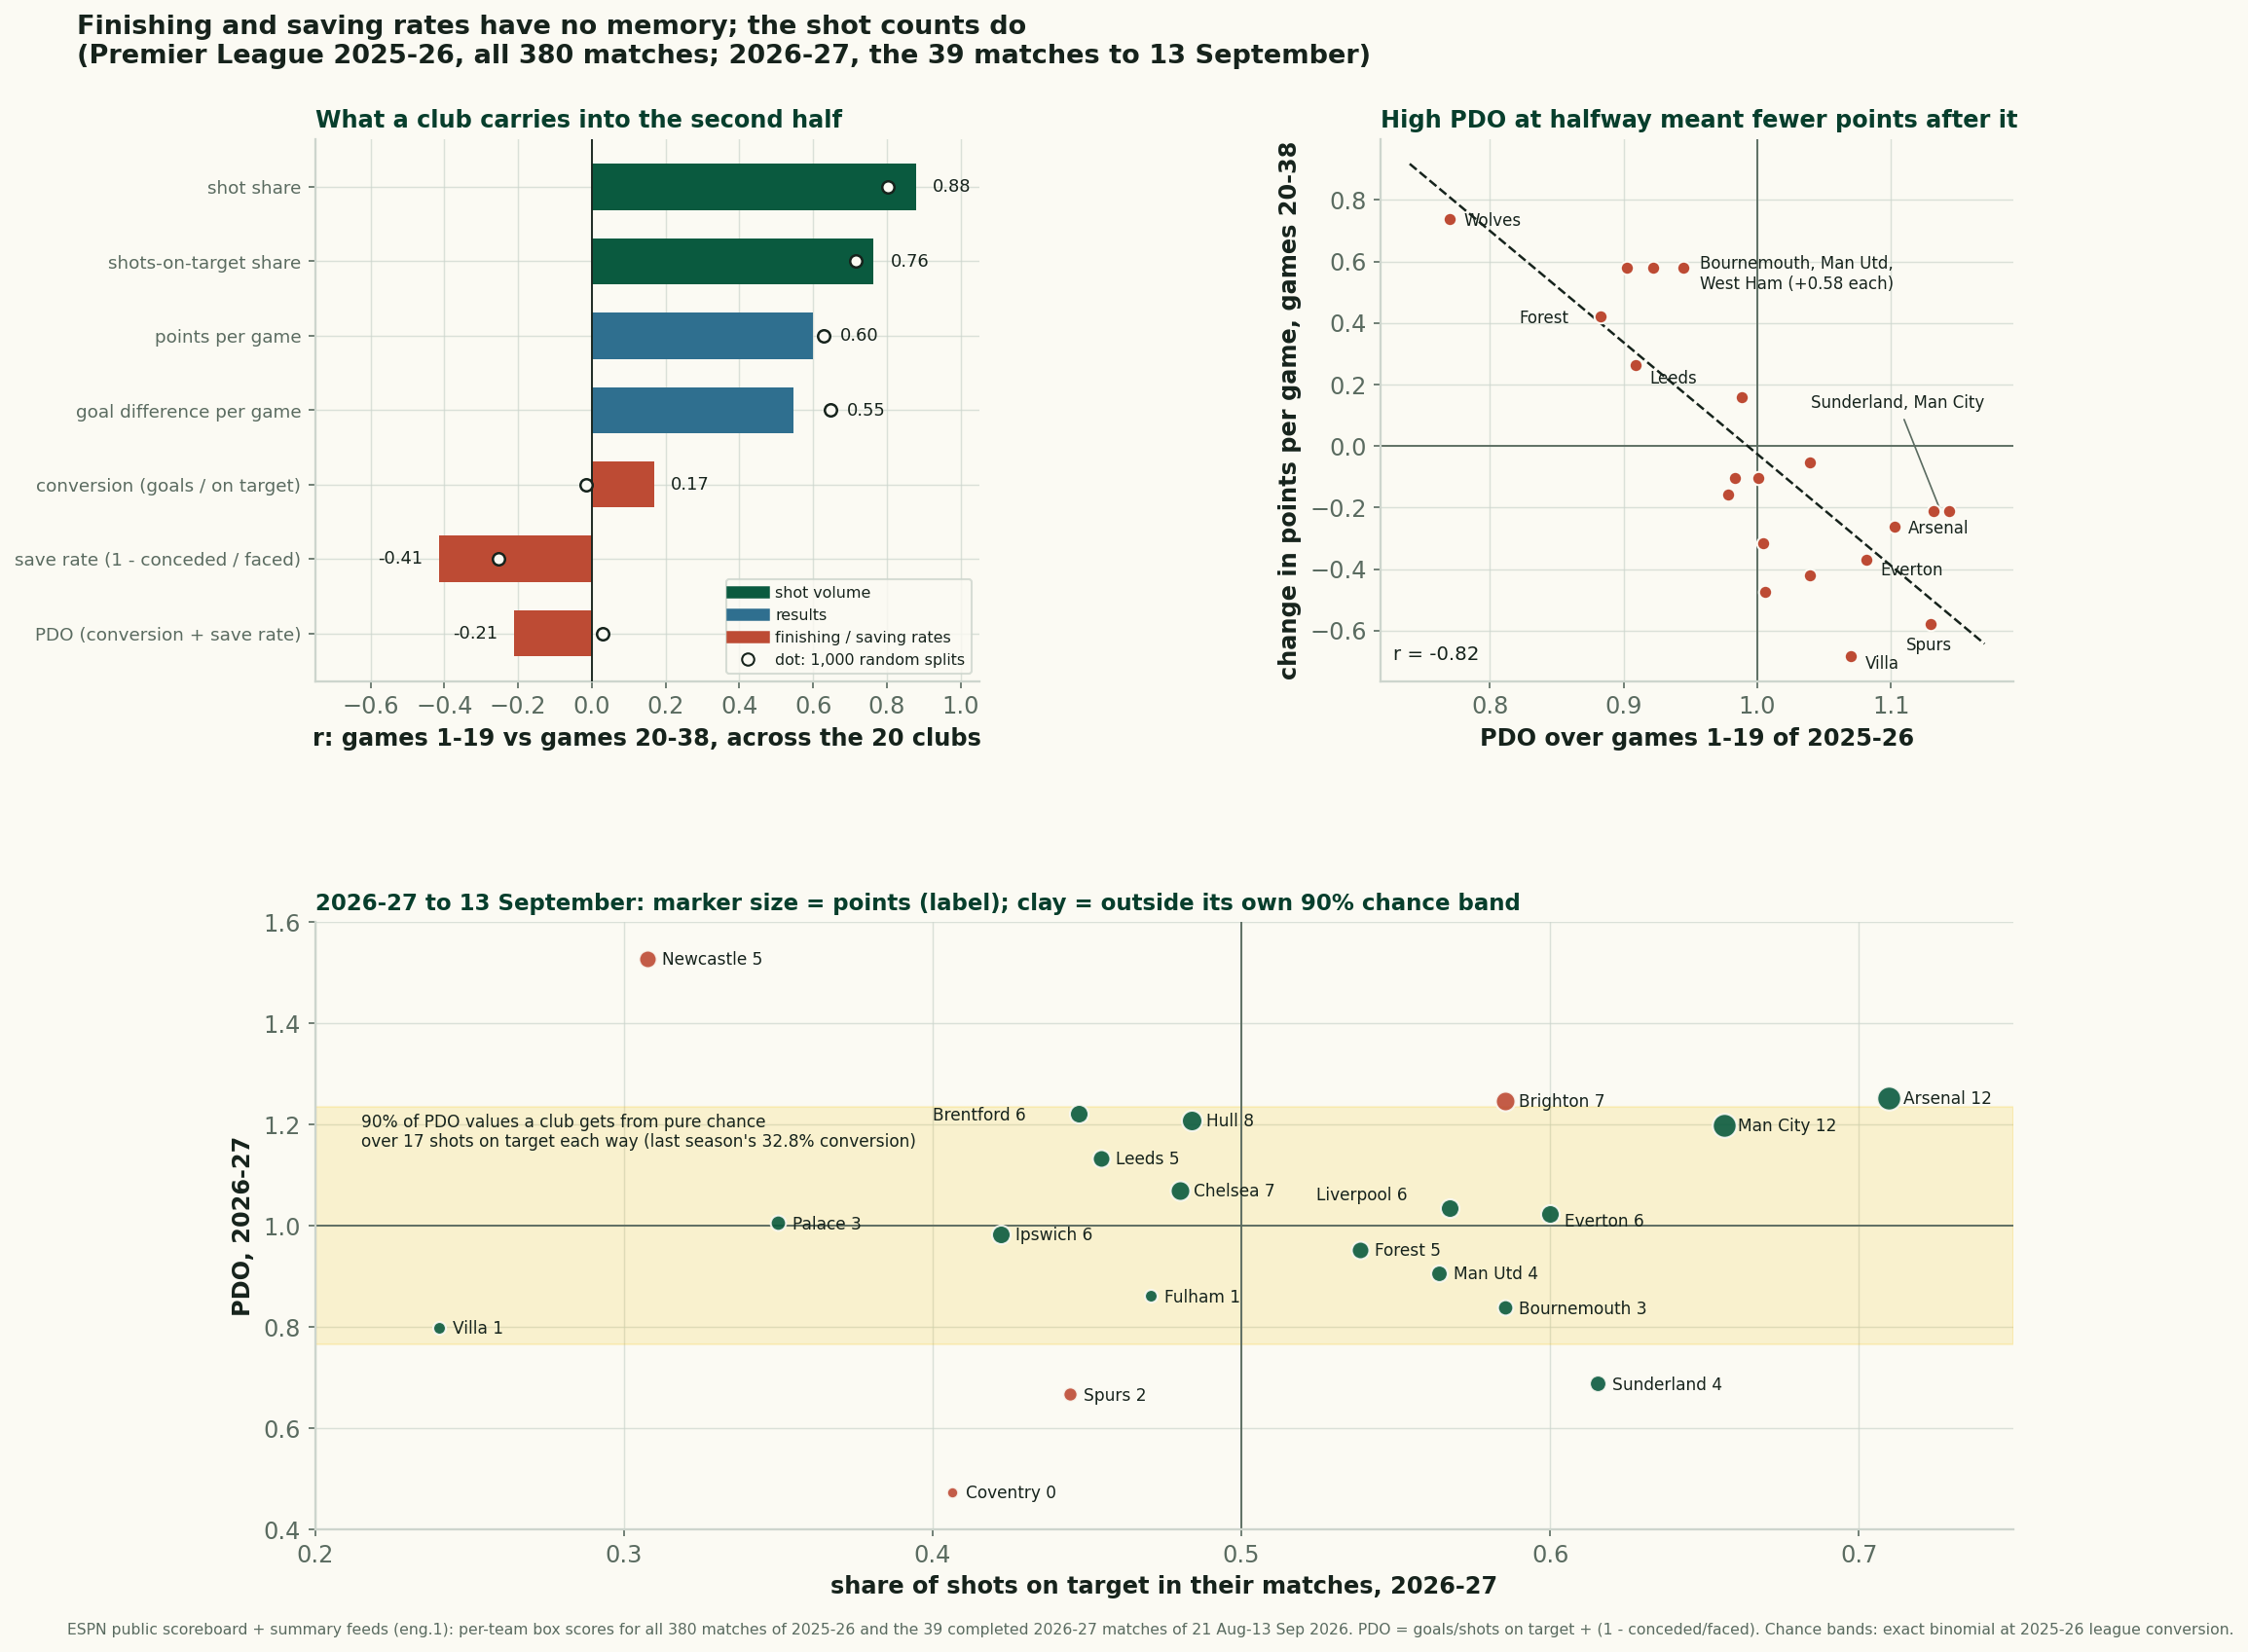
Finishing and Saving Rates Have No Memory
Last season a club's finishing and saving rates at halfway said nothing about its second half. Four rounds into 2026-27, those rates explain most of the table.