Manchester United Lead the League in Shots and Sit Twelfth
Two clubs are doing everything that looks like attacking and getting nothing for it. We replayed all 380 matches of last season to find out whether a five-game shot count is a warning or a leading indicator, and the answer is not the cynical one.
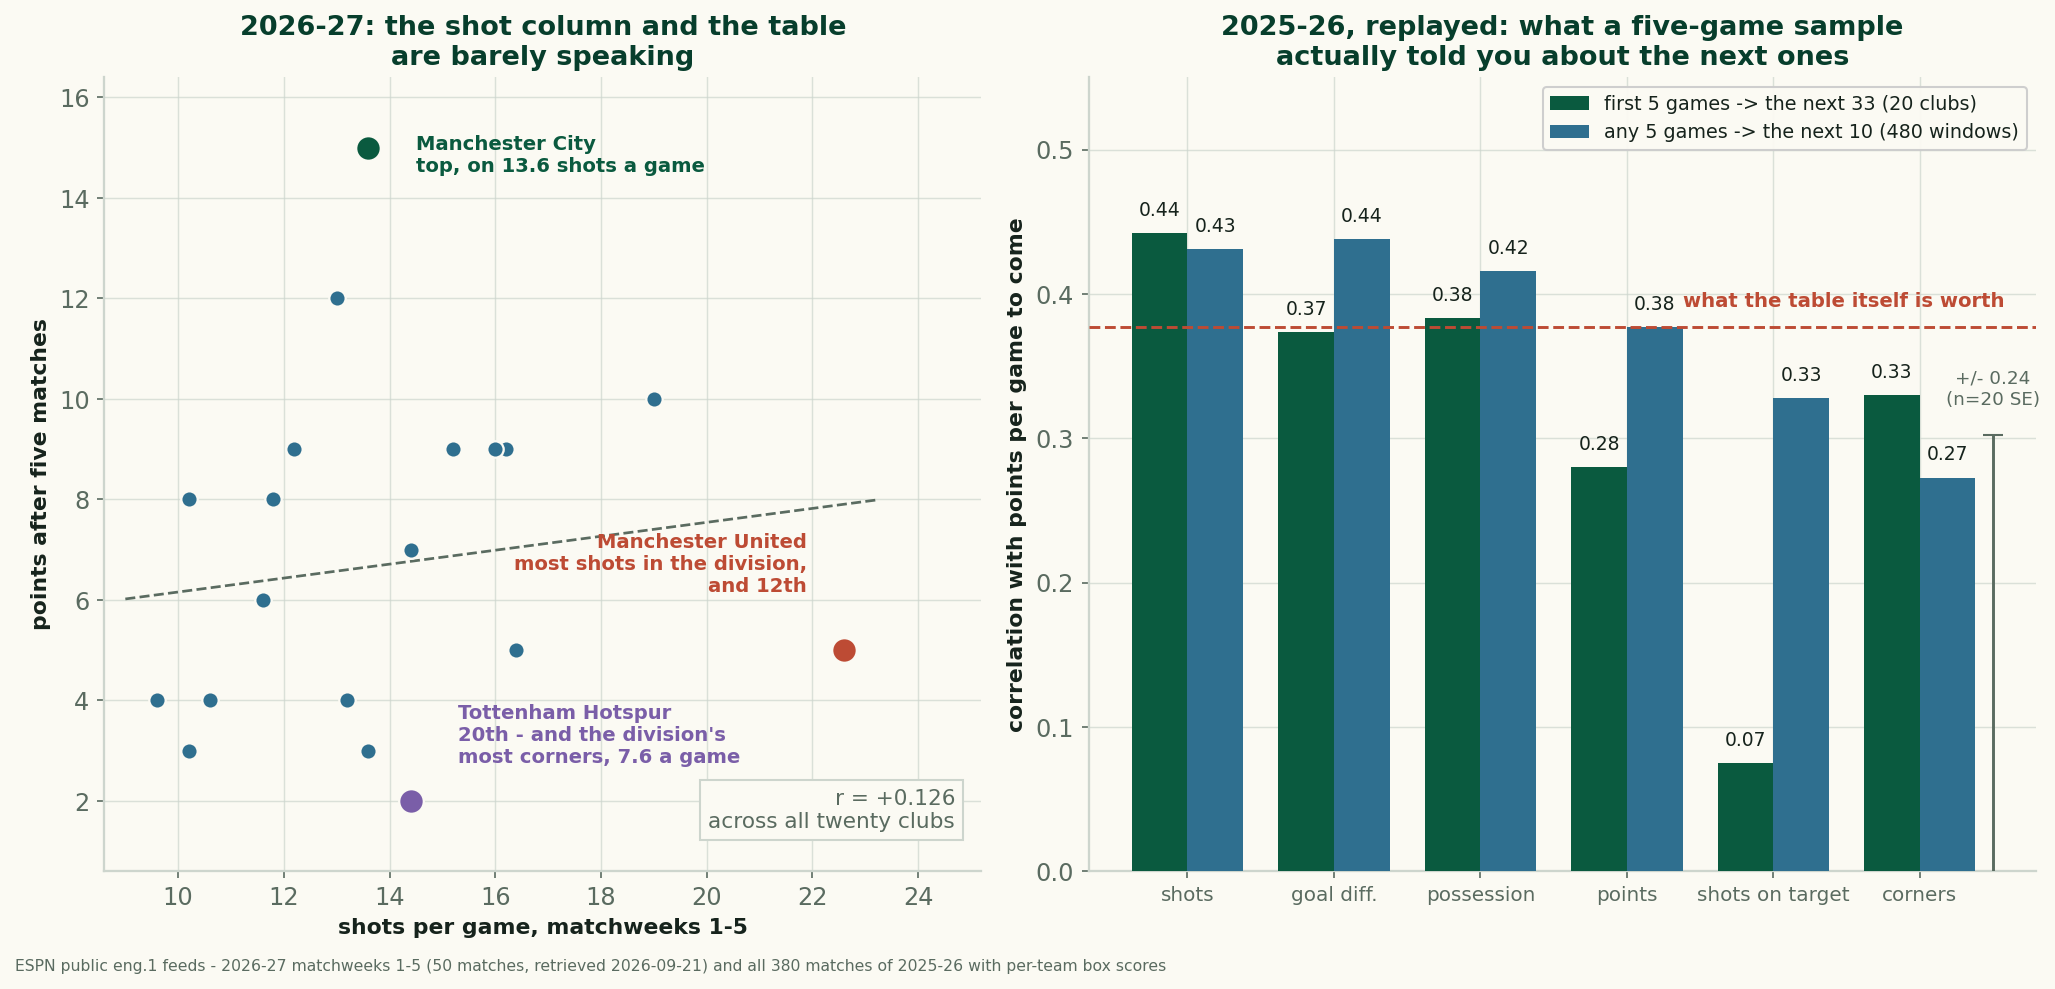
Five matchweeks into the 2026-27 Premier League, the club taking the most shots in the division is twelfth and the club winning the most corners is last. Manchester United have had 22.6 shots a game — three and a half a game clear of Brighton in second — the best pass accuracy in the league, and 5 points. Tottenham have won 7.6 corners a game, held 60.2% of the ball, and scored 2 goals in five matches. Across all twenty clubs the correlation between shots taken and points won is +0.126, which is another way of saying there is no relationship at all. The obvious reading is that both clubs are flattering themselves. The obvious reading is wrong, or at least the evidence does not support it: when we replay every one of last season's 380 matches, a five-game shot count predicts what a club does next better than its points do.
Sourcing. Two datasets, no models, no expected goals. This season is ESPN's public eng.1 scoreboard and summary feeds, completed matches only, re-pulled by data_layer/build_epl_results.py before every build and served at /data/epl_2026_27_results.json (50 completed matches as of 25 September 2026). This piece reads a fixed window of it: the 50 matches of matchweeks one to five, every club exactly five games, no part-played fixtures. The laboratory is last season — all 380 matches of 2025-26 with ESPN's per-team box scores, 380 of 380 summaries, none missing, at data_layer/epl_2025_26_boxscores.json. Every figure below is recomputed by charts/chart_epl_volume_vs_table.py, which exits non-zero if any of them stops reproducing.
The table after five matchweeks
Here is what the box scores say, sorted by the column everyone reads.
| Club | Pts | GF | GA | Shots | On target | Corners | Poss. |
|---|---|---|---|---|---|---|---|
| Manchester City | 15 | 13 | 5 | 13.6 | 5.4 | 6.2 | 63.2% |
| Arsenal | 12 | 8 | 4 | 13.0 | 4.8 | 5.2 | 59.4% |
| Brighton & Hove Albion | 10 | 16 | 5 | 19.0 | 5.8 | 5.4 | 64.7% |
| Brentford | 9 | 10 | 4 | 16.2 | 4.6 | 4.4 | 45.5% |
| Leeds United | 9 | 7 | 3 | 12.2 | 3.6 | 4.4 | 45.2% |
| Everton | 9 | 6 | 3 | 16.0 | 4.6 | 5.0 | 43.7% |
| Liverpool | 9 | 7 | 4 | 15.2 | 4.8 | 4.0 | 59.0% |
| Hull City | 8 | 6 | 4 | 11.8 | 3.8 | 3.4 | 32.5% |
| Newcastle United | 8 | 9 | 9 | 10.2 | 3.6 | 4.4 | 48.9% |
| Chelsea | 7 | 10 | 12 | 14.4 | 5.2 | 6.8 | 47.3% |
| Ipswich Town | 6 | 7 | 11 | 11.6 | 4.6 | 3.6 | 44.8% |
| Manchester United | 5 | 8 | 8 | 22.6 | 5.6 | 7.2 | 59.7% |
| Nottingham Forest | 5 | 4 | 5 | 16.4 | 3.4 | 3.4 | 47.3% |
| Sunderland | 4 | 6 | 10 | 13.2 | 5.0 | 4.0 | 48.5% |
| Crystal Palace | 4 | 6 | 11 | 10.6 | 3.6 | 2.4 | 43.4% |
| Aston Villa | 4 | 4 | 9 | 9.6 | 2.4 | 3.0 | 45.9% |
| AFC Bournemouth | 3 | 6 | 8 | 13.6 | 5.2 | 4.2 | 47.6% |
| Coventry City | 3 | 1 | 10 | 10.2 | 3.2 | 4.0 | 38.9% |
| Fulham | 2 | 5 | 8 | 14.4 | 4.4 | 5.6 | 54.2% |
| Tottenham Hotspur | 2 | 2 | 8 | 14.4 | 3.8 | 7.6 | 60.2% |
United have taken 113 shots and scored eight goals. Coventry, bottom but three, have taken 51 and scored one. And the division's correlations, across those twenty rows, rank the box-score columns in an order that should bother anyone who watches the corner count with interest:
| Measure | Correlation with points |
|---|---|
| Goal difference | +0.852 |
| Shots on target | +0.387 |
| Possession | +0.307 |
| Shots | +0.126 |
| Corners | +0.125 |
Goal difference correlating with points at +0.85 is not a finding; it is nearly the same fact stated twice. The rest of the table is the interesting part, and shots sitting level with corners at the bottom is the sentence that prompted this piece.
What a five-game sample was actually worth last season
A correlation measured within five matches only tells you what has already happened. The question that matters is different: if you knew nothing about a club except one of these numbers over five games, which one would you want?
Last season answers it. We cut all 380 matches of 2025-26 two ways. First, the honest replay of exactly this situation: each club's opening five matches against its points per game over the remaining 33. Twenty clubs, twenty observations. Then, because twenty observations is not many, every rolling five-game window in the season against that club's next ten — 480 windows.
| Five-game measure | Opening five → next 33 (20 clubs) | Any five → next ten (480 windows) |
|---|---|---|
| Shots | +0.442 | +0.431 |
| Goal difference | +0.374 | +0.438 |
| Possession | +0.383 | +0.416 |
| Points | +0.280 | +0.377 |
| Shots on target | +0.075 | +0.328 |
| Corners | +0.330 | +0.273 |
Shots come first on one cut and second by three thousandths on the other. Points — the column the entire sport organises itself around — come fourth both times. On the opening cut, a club's five-game shot count carried more information about the next 33 matches than its actual results did.
The inversion of shots on target is the oddest line in the table and worth naming rather than hiding: over the opening five it predicted essentially nothing (+0.075) while over rolling windows it did respectable work (+0.328). We do not have an explanation we believe. With twenty clubs and one season, the most likely explanation is that the opening figure is noise and the rolling one is closer to the truth, which is a reason to distrust every number in the left-hand column, including the one in bold.
The part where we argue with our own table
None of these gaps is statistically significant, and it would be dishonest to present them as if they were.
The rolling cut looks like 480 observations. It is not. Those windows overlap heavily — consecutive windows share four of five matches — and they come from only twenty independent club paths through one season. The effective sample is nearer twenty than 480, and at n = 20 the standard error on a correlation is ±0.243. The gap between shots at +0.431 and points at +0.377 is 0.054. The gap on the opening cut is 0.162. Both sit comfortably inside one standard error. If we ran this again on 2024-25 we would not be surprised to see the order change.
What survives that caveat is smaller and still useful: there is no evidence here that a five-game shot count is worth less than a five-game points total, and the two cuts agree with each other on direction. The cynical reading of United — that all those shots are empty volume, and the table is telling the real story — is the one the data declines to support.
This is also a different question from the one we asked on September 11, and the distinction matters. That piece measured whether a club's early numbers agree with its own numbers later — how quickly each statistic becomes a stable description of a team. This one measures whether an early number predicts a different quantity entirely: results to come. A statistic can be highly self-consistent and still tell you nothing about points, and passing accuracy is close to exactly that.
United have done this before
The most direct evidence available is a single club, and it happens to be the right one.
In 2025-26, Manchester United also led the Premier League in shots over the opening five matches — 16.2 a game — and also underperformed, taking 7 points from those five. Over the remaining 33 they took 1.94 points a game, a 74-point pace across a full season. The shot count was right and the table was wrong.
Tottenham ran the opposite experiment. They opened 2025-26 on 10 points from five with 6.2 corners a game, joint fourth-most in the division, and then took 0.94 points a game over the remaining 33 — barely a third of United's rate from a start three points better. The corner count did not save them, which is consistent with corners finishing last in the rolling column above and with what this site found in a different competition entirely.
One club, one season, and we are not going to pretend an anecdote is a test. But it is the anecdote that fits the table, and this season's United are 6.4 shots a game clear of where last season's version stood.
What we would actually say about these two clubs
United's problem is real and it is not shot volume. Eight goals from 113 shots is a 7.1% conversion rate, and something between the quality of those chances and the quality of the finishing is going badly. But the club is generating the raw material at a rate nobody else in the division is close to, and last season's replay says that is the part which tends to persist. The conversion rate, as this site established a week ago, is the part that does not.
Tottenham are a harder case, and the numbers are less kind. Their shot count is mid-table at 14.4. Their corner count is the best in the league and corners are the worst-performing column in the whole exercise. Sixty percent possession and two goals in five matches is the profile of a side that reaches the final third and stops, and unlike United there is no volume number underneath it doing quiet work.
Both readings could be wrong by November. That is rather the point of a piece about what five matches can and cannot support.
Sources & Further Reading
- ESPN public soccer feeds (eng.1 scoreboard and match summary endpoints): the 2026-27 completed matches and per-team box scores, retrieved 2026-09-21, and all 380 matches of 2025-26. Built by
data_layer/build_epl_results.pyanddata_layer/build_epl_2025_boxscores.py; verified bycharts/chart_epl_volume_vs_table.py. - Three Games Tell You How a Team Plays, Not How Good It Is: the companion question — how fast each statistic becomes a stable description of a club, rather than a predictor of its results.
- Finishing and Saving Rates Have No Memory: why United's 7.1% conversion is the part of this least worth extrapolating.
- Home Advantage Didn't Die. The Results Column Can't See It: the same argument about the points column, made three days and ten matches ago.
- Do Corners Matter? The corner count measured on 184 team-games of a different competition, with the same answer.
- The Shots-on-Target Rule: the channel that wins matches on the day, as distinct from the one that predicts the next ten.
More from Data Deep-Dives
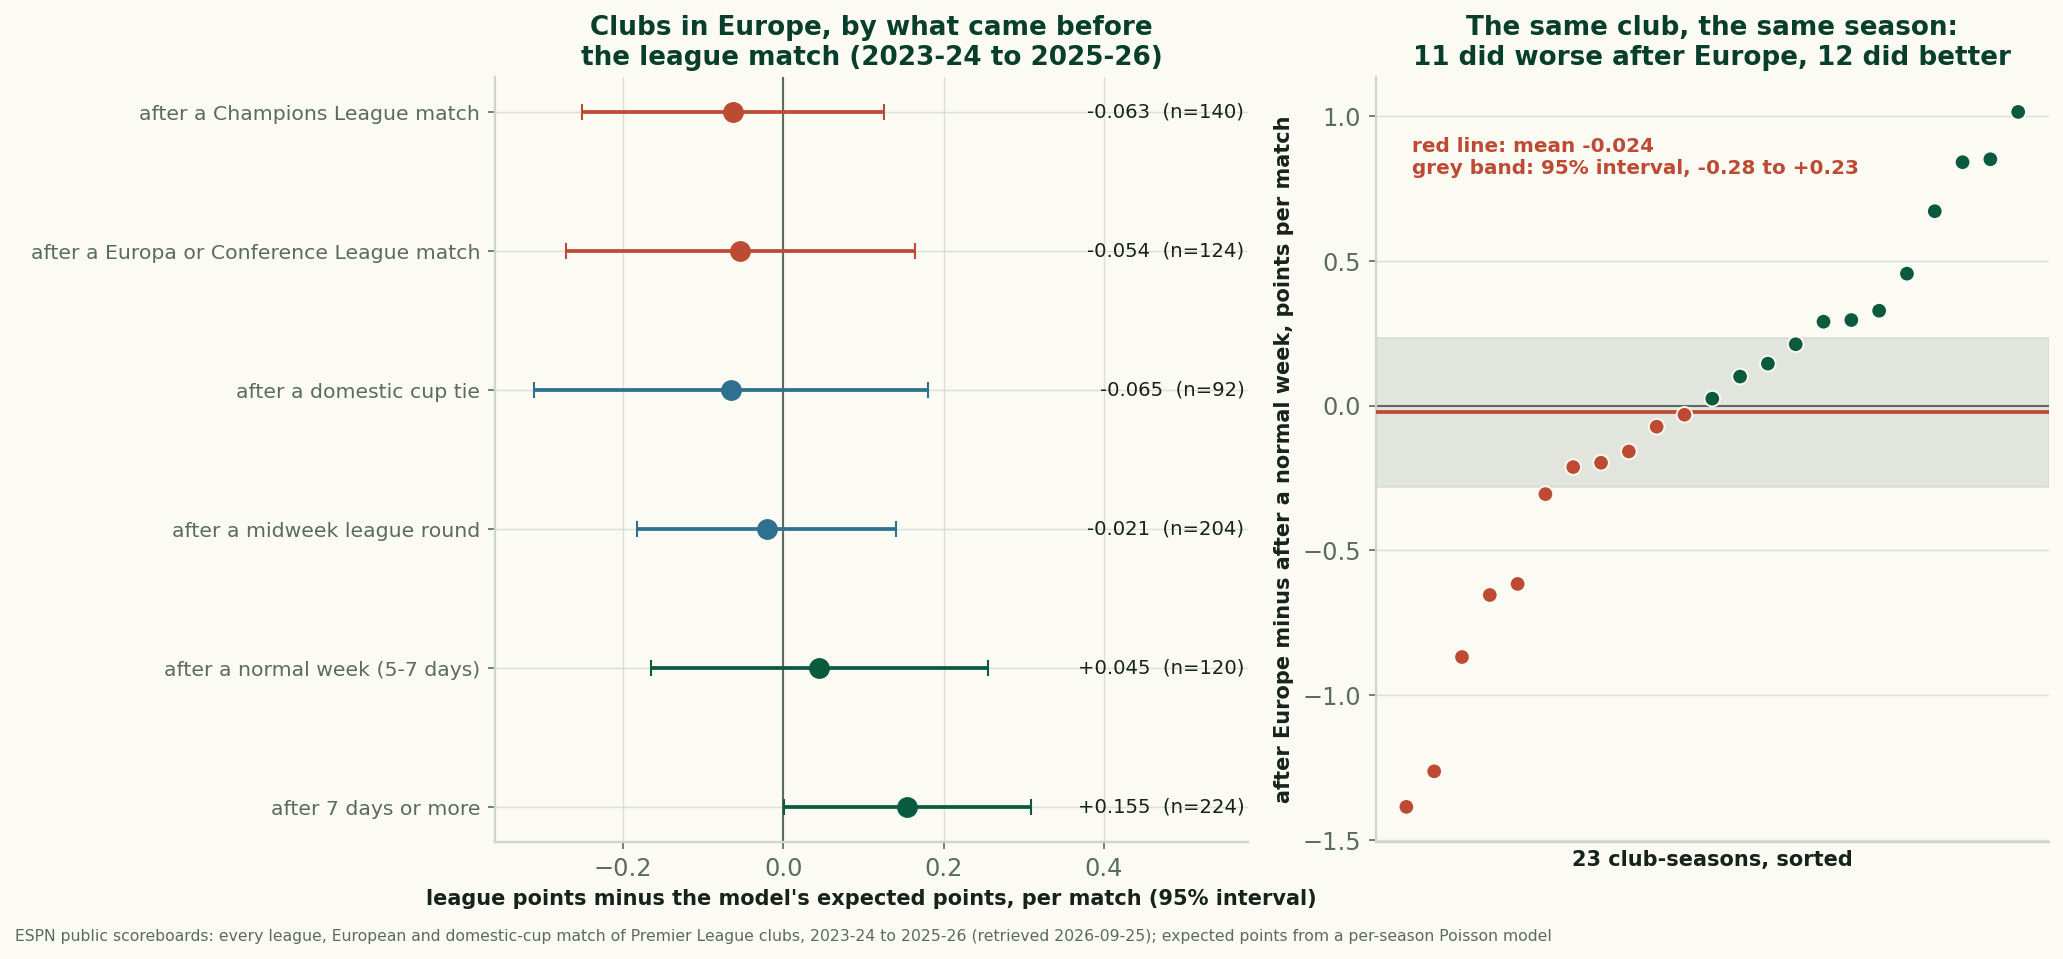
Does Europe Cost English Clubs at the Weekend? Three Seasons Can't Find It
After a European night, English clubs took 1.56 league points a match against 1.62 expected. Within the same club and season the gap is -0.024: not measurable.
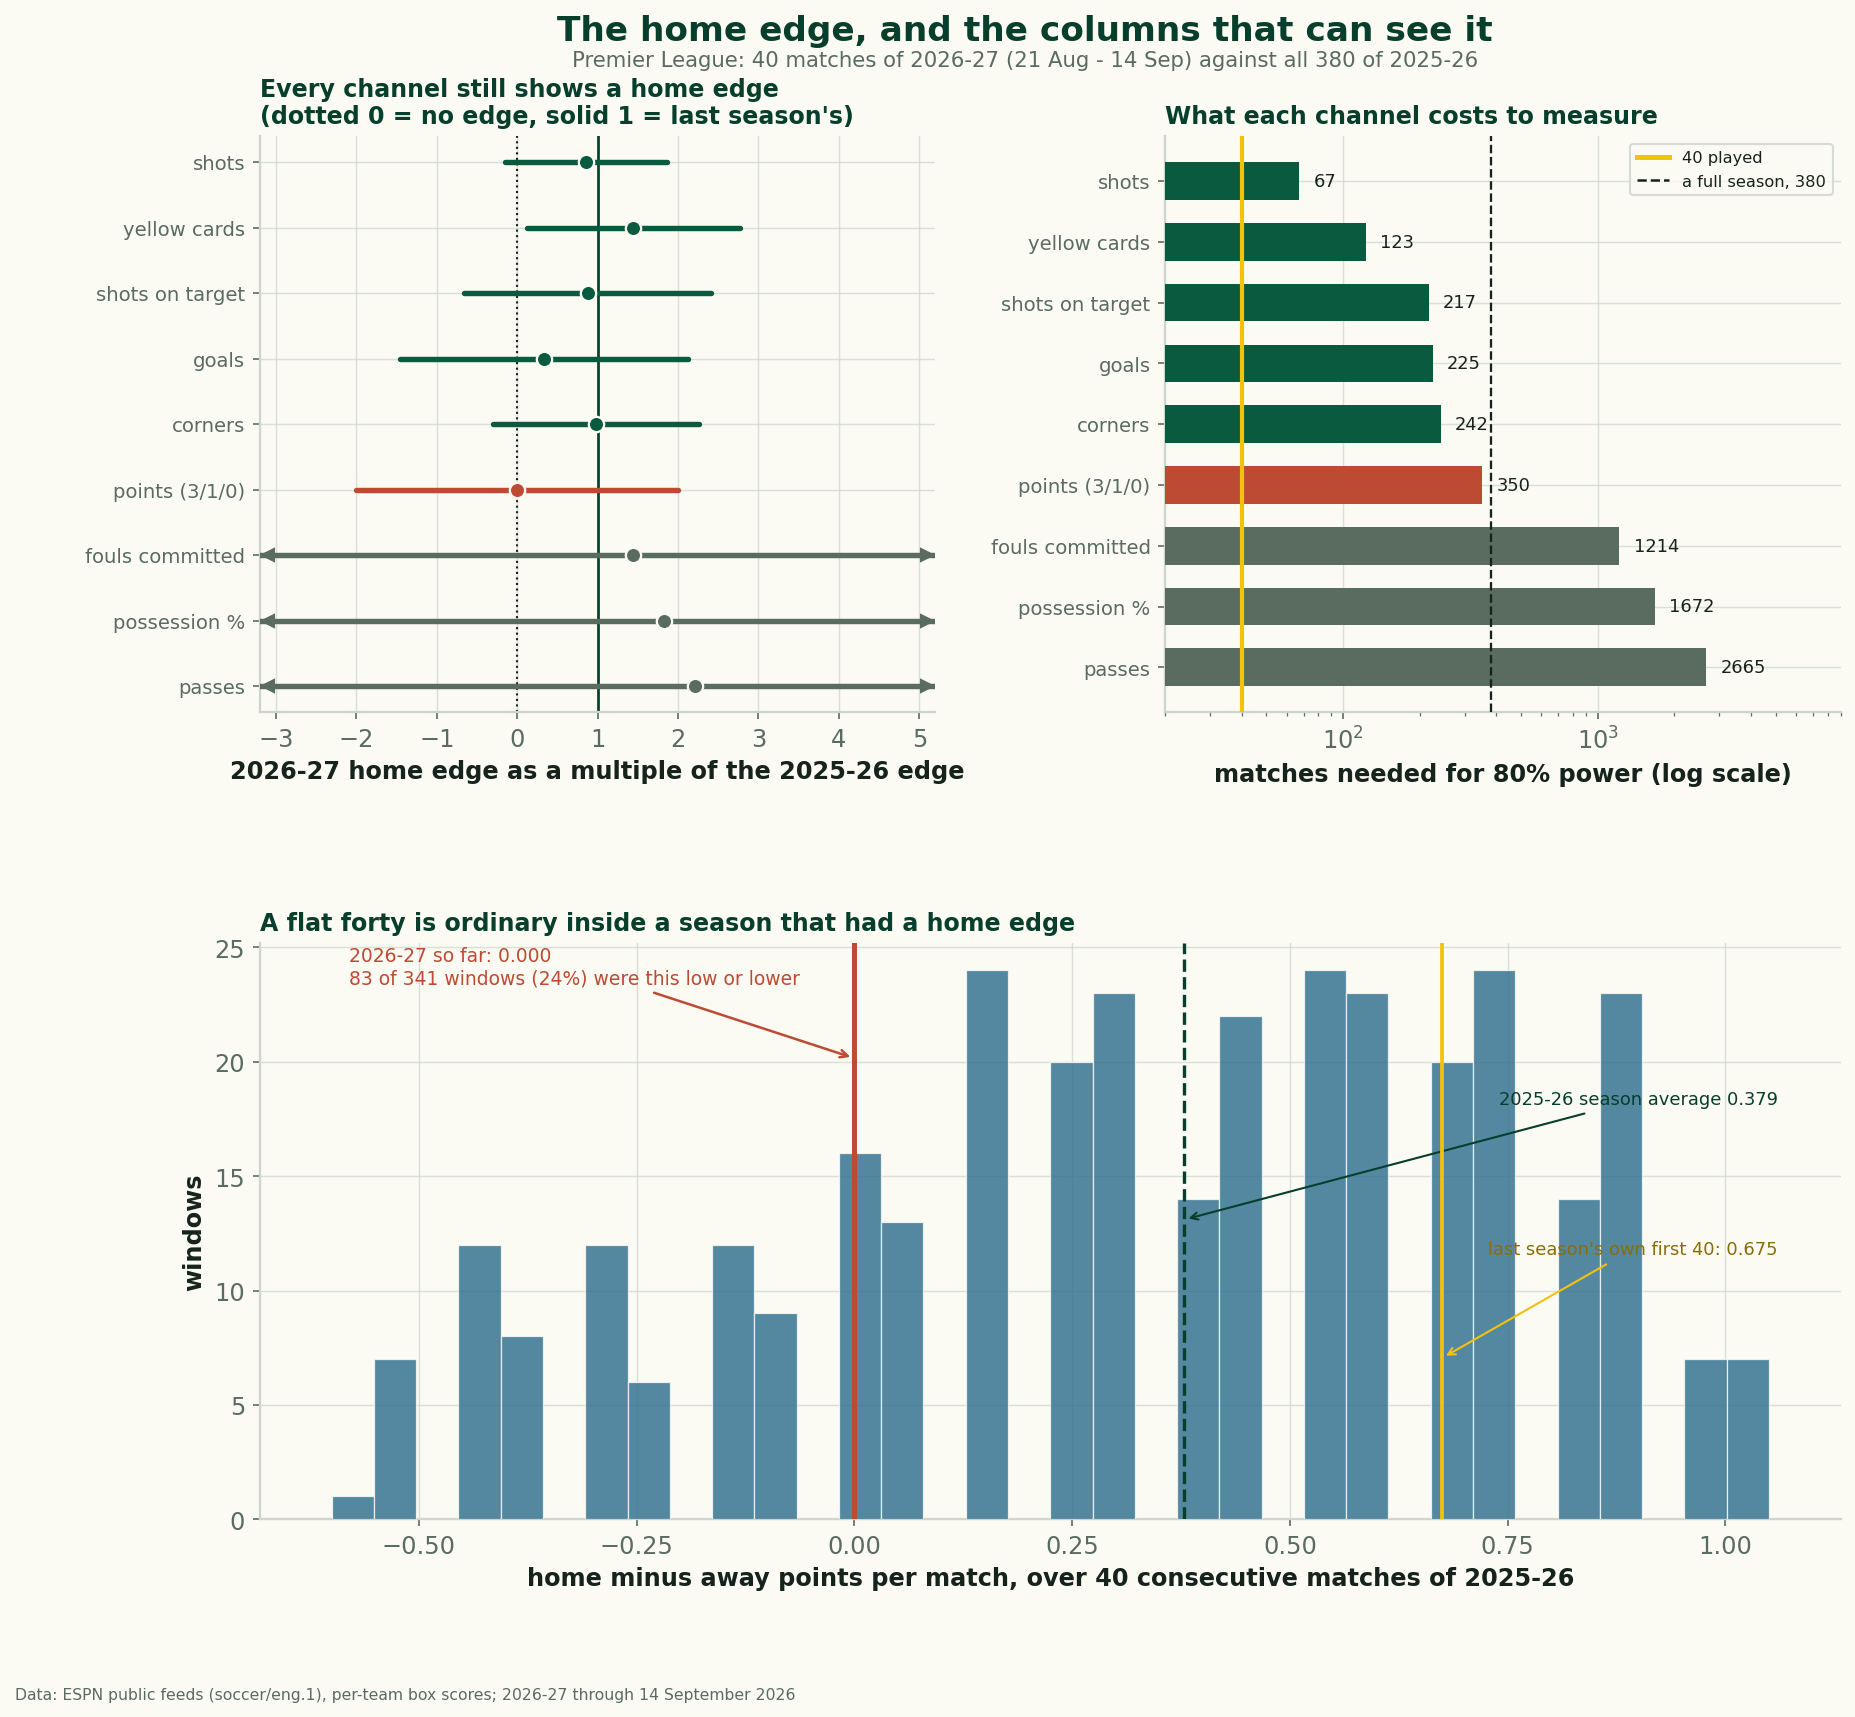
Home Advantage Didn't Die. The Results Column Can't See It
Home and away split the first 40 matches of 2026-27 evenly, yet the shot, corner and card columns keep the home edge. Plus a decade of home-advantage data.
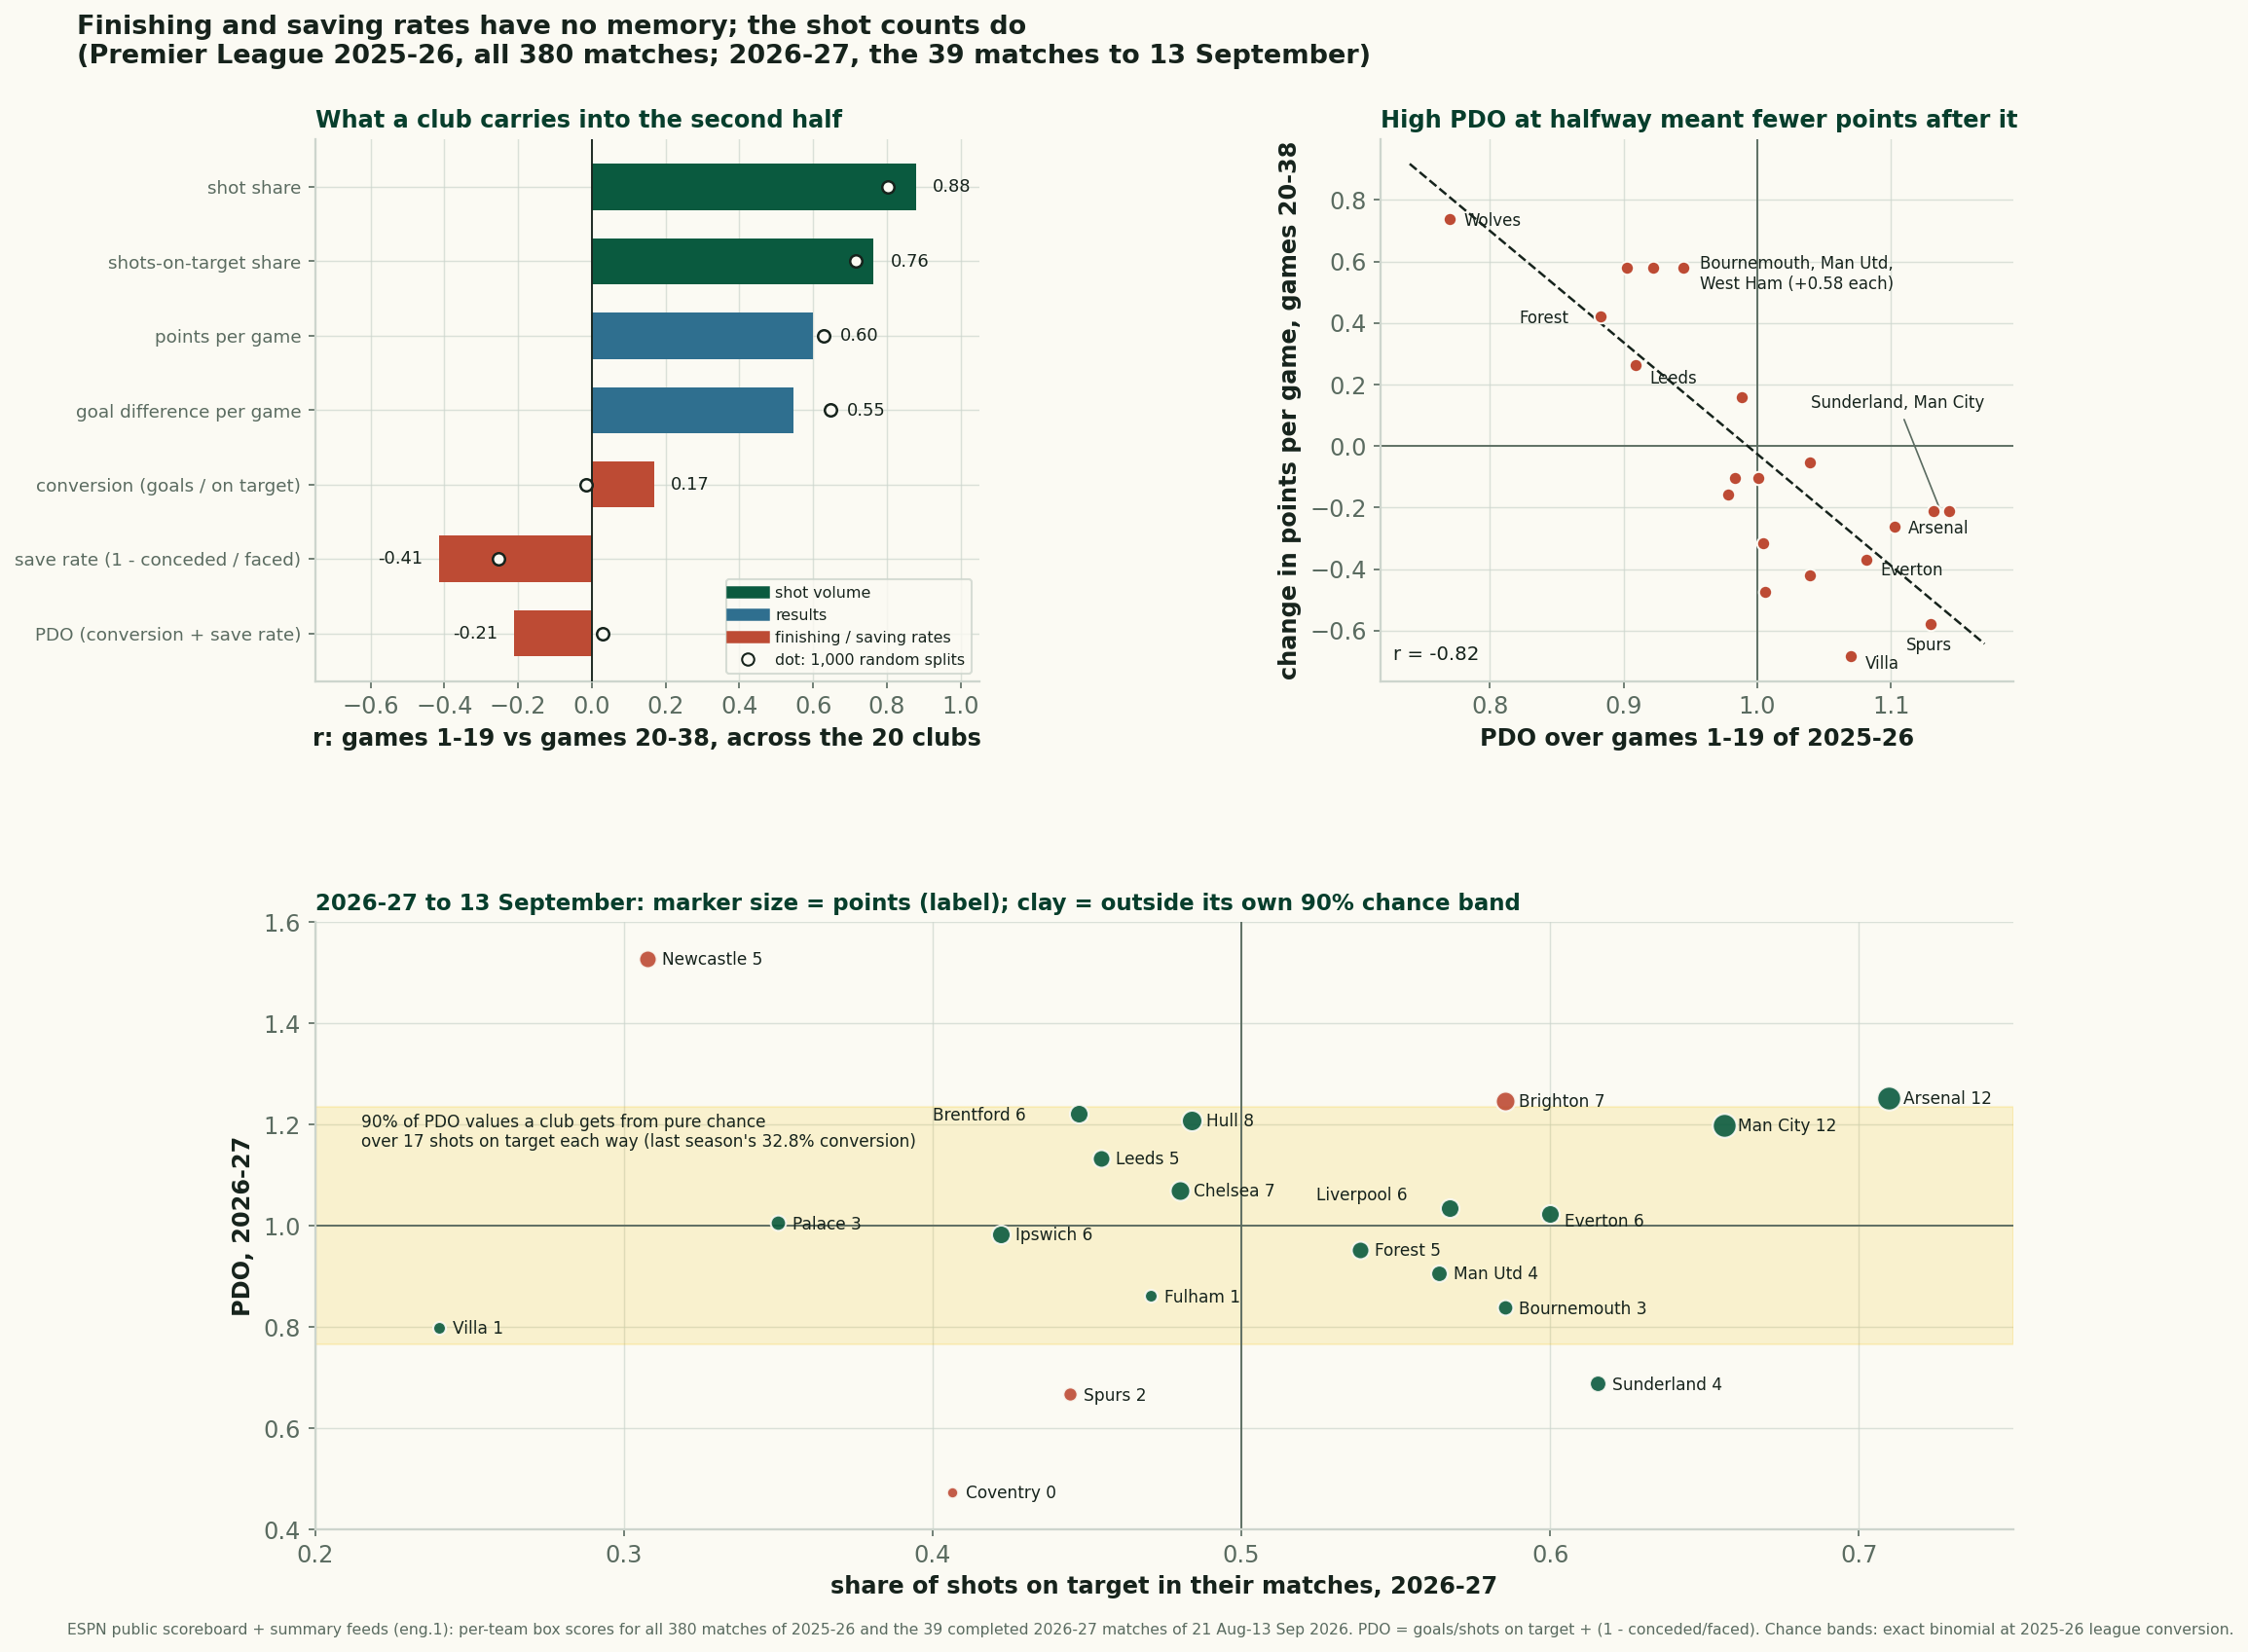
Finishing and Saving Rates Have No Memory
Last season a club's finishing and saving rates at halfway said nothing about its second half. Four rounds into 2026-27, those rates explain most of the table.