The Whistle Is Busier and the Cards Are Not
Thirty matches produce a discipline table, and the discipline table produces a theory about how the season is being refereed. We built the noise band first, then looked. The cards are ordinary, the fouls are almost interesting, and the club column is a coin.
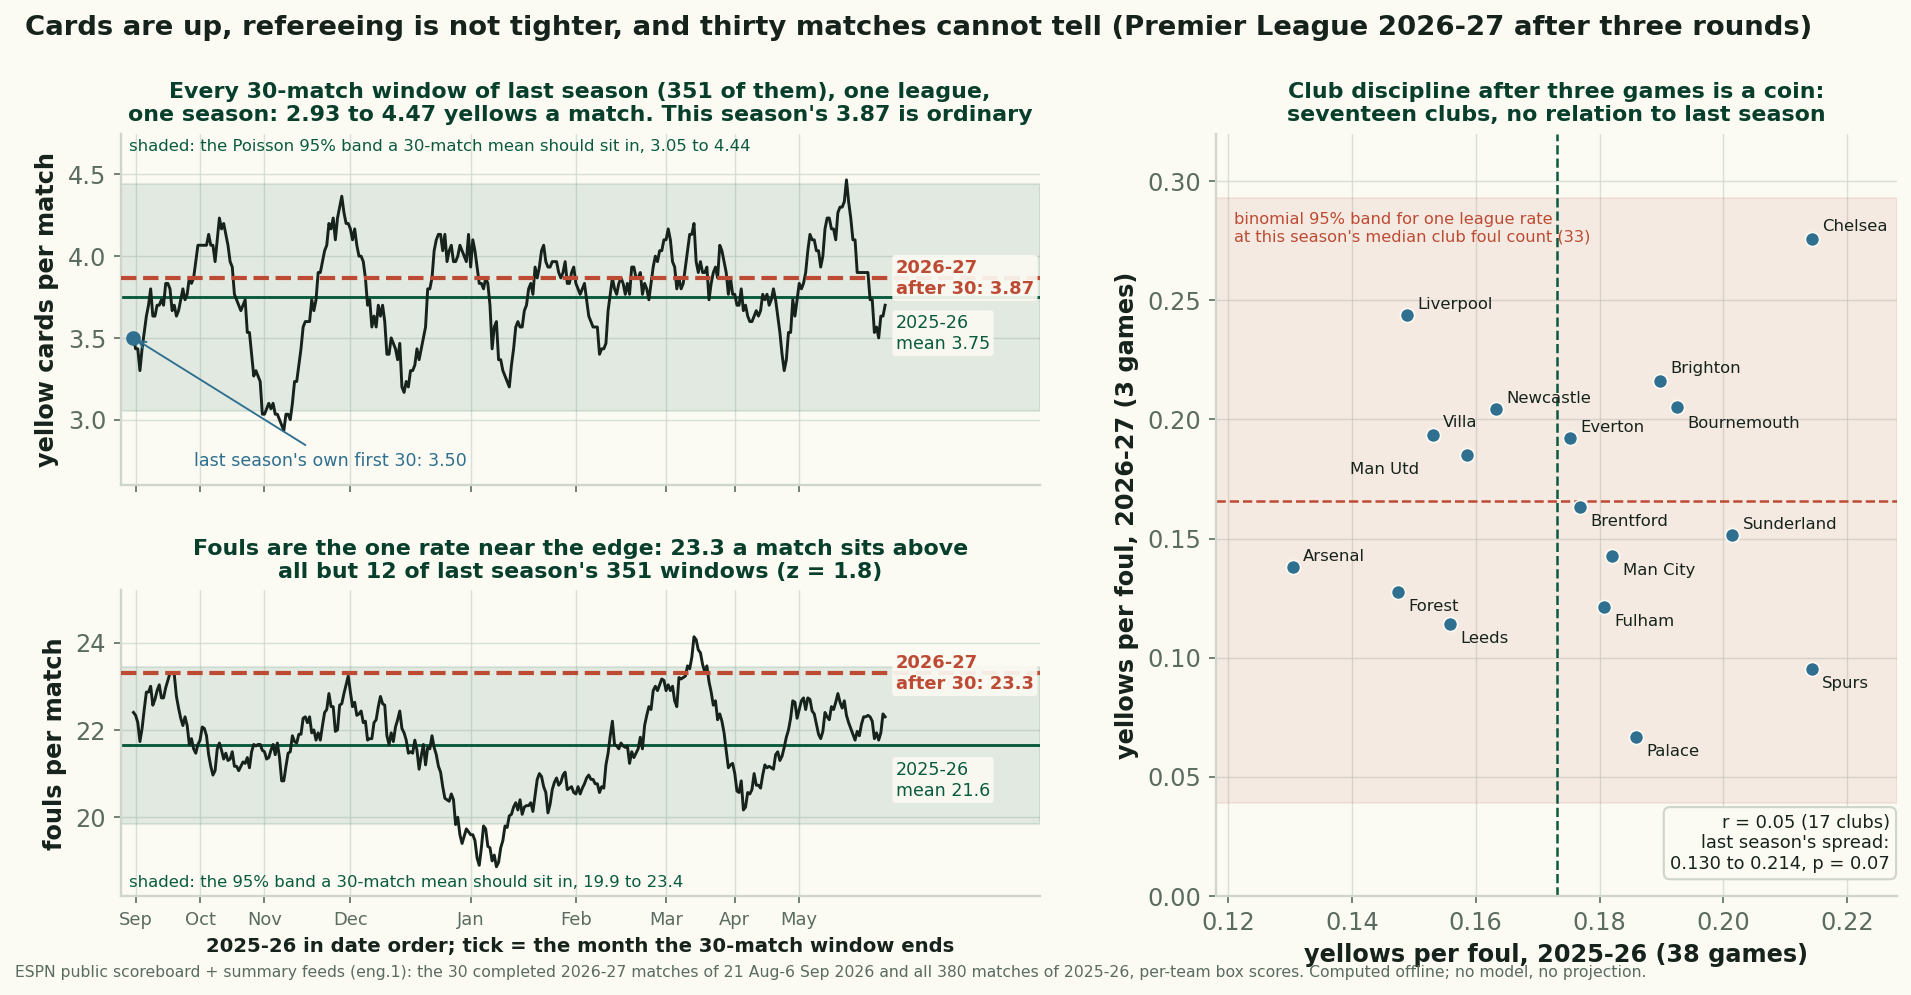
Three rounds of the 2026-27 Premier League are in the books, and the discipline column reads like a story: 116 yellow cards in 30 matches, or 3.87 a game, against 3.75 across all 380 games of last season. Cards are up 3.2%. Fouls are up 7.6%, from 21.65 a match to 23.30. The obvious sentence writes itself, and it is wrong. Measured against the only baseline we have — last season's own 380 matches, refereed under the same laws by the same organisation — the card rate sits 0.34 standard deviations from par, and 243 of the 351 thirty-match windows inside last season itself sat further from that season's own mean than this season sits from it. The one number with a pulse is fouls, at z = 1.81. And the moment you decompose the extra cards, the direction reverses: more fouls are being called, and fewer of them are being booked. Per foul, this is a marginally looser start, not a tighter one.
Sourcing. Two datasets, no models. The current season is ESPN's public scoreboard and summary feeds for eng.1, completed matches only — the 30 games played between 21 August and 6 September 2026, matchweeks one to three, ten fixtures each, every club exactly three games. That snapshot is pulled by data_layer/refresh_epl.py, served at /data/epl_2026_27_results.json, and re-pulled before every build; it holds 50 completed matches as of 25 September 2026, and this piece filters it to the August-September window by date, so later rounds cannot quietly walk into the figures. The baseline is all 380 matches of 2025-26 with the same per-team box scores, pulled by data_layer/build_epl_2025_boxscores.py and served at data_layer/epl_2025_26_boxscores.json — 380 of 380 match summaries returned, none missing, and the scoreline of every row cross-checked against the results file this site has published since August. Fouls, yellows and reds are the provider's per-team counts. All 149 figures below are recomputed offline from those two files by charts/chart_epl_discipline_baseline.py, which redraws the chart on this page and exits non-zero if any published number stops reproducing.
Build the noise band before you look
The rate that matters is cards per match, and the honest first question is how much a 30-match sample of it wobbles when nothing has changed. Yellow cards behave close to a Poisson count: last season's per-match totals had a mean of 3.747 and a variance of 3.794, a dispersion index of 1.012, which is about as close to the Poisson ideal as football data gets. A chi-square goodness-of-fit test on the nine buckets from zero cards to eight-or-more gives 11.1 with p = 0.20, so the model survives contact with the season. That matters because goals in the same league do not behave this way; the Poisson fit to World Cup goals came back visibly overdispersed. Cards are the better-behaved count.
So: 30 matches at last season's rate expects 112.4 yellows with a standard deviation of 10.60. This season produced 116, which is 3.6 above expectation, a z of 0.34, and a one-tailed probability of 0.380. Roughly two starts in five would be at least this carded with nothing whatever having changed. Converting to a rate, the 95% band for a 30-match mean runs 3.05 to 4.44 cards a game. To clear the top of it, this season's opening rounds would have needed 134 yellows, or 4.47 a match, half a card a game more than they produced.
The other direction is worth naming for the same reason. Red cards are down: 44 in 380 games last season is 0.116 a match, which expects 3.47 in a 30-match window, and there has been exactly one, Aston Villa's at Brighton on 23 August. That looks like a collapse and is not: P(one or fewer) is 0.139. A rate that rare needs a season, not a fortnight, and we will not be writing that red cards have gone out of fashion on the evidence of two missing sendings-off.
The 351-window test
The Poisson band is a model, so here is the same question asked with no model at all. Take last season's 380 matches in date order and compute the card rate in every consecutive 30-match window. There are 351 of them, all from one season, one competition, one rulebook. The rate ranges from 2.93 a match, in the window opening on 18 October 2025, to 4.47, in the window opening on 24 April 2026. That is the actual size of a fortnight's worth of variation in a quantity nobody claims changed mid-season.
This season's 3.87 falls at or below 214 of those 351 windows and at or above 151 of them. It is not near an edge. Better: count the windows that sit at least as far from last season's mean as this season does, in either direction, and you get 243 of 351. Seven windows in ten inside a single stable season deviated more than the number people are currently building theories on. Cut the season into twelve non-overlapping 30-match blocks instead, to remove the overlap that makes rolling windows autocorrelated, and the block means run from 3.03 to 4.30 with a standard deviation of 0.339 — almost exactly the 0.353 the Poisson predicts. The variation is not a story. It is arithmetic.
Last season's own opening fortnight makes the point sharpest. The first 30 matches of 2025-26, played between 15 and 31 August 2025, ran at 3.50 cards a match; the remaining 350 ran at 3.769. Anyone who wrote "the referees have gone soft" on 1 September 2025 was wrong within a month: September 2025's 30 matches produced 4.067 cards a game, and October's 30 produced 3.033. Those two months differ from each other by more than this season differs from last season, and they were the same season.
The one number with a pulse
Fouls are the exception, and we want to give them their due before taking it back. Last season's per-match foul count had a standard deviation of 5.01, so a 30-match mean has a standard error of 0.914. This season's 23.30 sits 1.65 fouls a match above last season's 21.65, a z of 1.81 and a two-sided p of 0.07. In the rolling-window frame it is stronger than that sounds: only 12 of the 351 windows reached 23.30 fouls a match, and no non-overlapping block did, the highest being 22.57. Nearly 50 more fouls have been called in these 30 games than last season's rate expects.
That is a real candidate for a signal, and it is also the least newsworthy possible one, because a foul is not a sanction. The interesting quantity is what happens after the whistle.
Worked: where the extra 0.119 cards came from
Cards per match is the product of two things: fouls per match, and the share of fouls that get booked. Last season those were 21.647 and 0.17311 yellows per foul; 21.647 × 0.17311 = 3.747. This season they are 23.300 and 0.16595; 23.300 × 0.16595 = 3.867. The difference to explain is +0.119 cards a match, and it splits cleanly.
- Fouls, holding conversion fixed. 23.300 × 0.17311 = 4.033 cards a match. Against last season's 3.747, that is +0.286. If referees were booking at last season's rate, this season's foul count alone would have produced four cards a game.
- Conversion, holding fouls fixed. 21.647 × 0.16595 = 3.592. That is −0.155. The drop in booking rate is eating more than half of the extra fouls.
- Interaction. −0.012, the leftover when both move at once. The three sum to +0.119, which is the whole observed change.
So the card rate is up because there are more fouls, in spite of a booking rate that is down 4.1%. That is the opposite shape from a crackdown. A tighter league would show conversion rising, with or without a foul count to match; this shows a busier whistle attached to a slightly more forgiving pocket. And even the conversion drop is not real on its own terms: 101 of last season's 351 windows had a booking rate at or below 0.166, and the window range runs 0.140 to 0.210. Both halves of the decomposition are inside their own noise. It is the direction that is worth publishing, because it is the direction nobody assumes.
The away premium survives, at the same size
One discipline pattern in this data is old, well evidenced and worth checking against a fresh sample: visiting teams get booked more. Last season, away sides committed 4,179 of 8,226 fouls — 50.8%, essentially half — but collected 791 of 1,424 yellows, 55.5%. Per foul, the away rate was 0.189 against the home rate of 0.156, a premium of 1.21×. This season the foul split is again even at 50.6% away, while the cards run 66 to 50, or 56.9% away, and the per-foul premium is 1.29×.
The premium is intact and the increase is nothing: 116 cards at last season's away share expects 64.4 away yellows with a standard deviation of 5.35, and there have been 66, a z of 0.29 and a binomial p of 0.78. Which is the useful result here, because it is the one figure in this piece we would have been happy to see move. The home-advantage piece catalogued referee bias as the best-evidenced mechanism behind home advantage, on a body of research spanning decades and leagues. Thirty matches of 2026-27 reproduce it at the same magnitude, on an independent feed. That is a replication, not a finding, and replications are how you learn a data source is not lying to you.
The club column is a coin
Now the part of the discipline table people actually read: who is dirty. This season's leaders in yellows per foul are Hull City, at 8 cards from 28 fouls (0.286), and Chelsea, at 8 from 29 (0.276). At the bottom sit Crystal Palace, 2 from 30 (0.067). That is a spread of 0.219 between the most and least booked clubs per foul, which sounds enormous.
It is what a single league rate produces. A club has committed about 33 fouls; the binomial standard deviation of a rate estimated on 35 trials at 0.166 is 0.063, against 0.019 for the 402-foul samples clubs accumulated last season. Draw the 95% band for one common rate at this season's median club foul count and it runs from 0.039 to 0.293: all twenty clubs are inside it, top to bottom. Simulate 20,000 seasons in which every club is booked at the identical league rate on its own real foul count, and the median simulated spread between the extremes is 0.235, wider than the 0.219 actually observed; 64% of simulated leagues are more spread out than the real one. A chi-square for homogeneity across the twenty clubs gives 16.4 on 19 degrees of freedom, p = 0.63. There is no club effect in this data yet, and the honest thing to say about Palace and Hull is nothing at all.
That is not because clubs never differ. Over 38 games last season they clearly did: the same chi-square on fouls per game gives 47.9, p = 0.0003, and on yellows per game 42.6, p = 0.0015, with Wolves at 13.00 fouls a game against Manchester City's 9.68, and Chelsea and Tottenham topping the booking rate at 0.214 against Arsenal's 0.130. Real, measured, season-length differences exist. They just do not survive being estimated on three games. Across the 17 clubs in both seasons, the correlation between last season's yellows-per-foul and this season's is 0.05; for fouls per game it is 0.20 and for yellows per game 0.01.
Before anyone blames the promoted clubs or a squad rebuild for that, we ran the same test inside a single season, where nothing changed at all: correlate each club's first three games of 2025-26 with its remaining 35, and the booking rate correlates at 0.053, fouls per game at 0.295, cards per game at 0.220. Split that season in half instead, 19 games against 19, and the same correlations rise to 0.246, 0.410 and 0.485. Three games is simply not enough to measure a club's discipline, in any season, including a season we can see all of. The scatter on the right of the chart above is what three games buys you, and it buys you nothing.
What thirty matches cannot tell you
- One baseline season. Everything here is measured against 2025-26 alone. If refereeing standards moved between 2024-25 and 2025-26, this piece cannot see it, and "no change since last season" is a narrower claim than "no change". A three-season baseline would price that, and it is the obvious extension.
- A foul is a decision, not an event. The foul count is the referee's whistle count, not a count of illegal challenges. A rise in fouls given is consistent with more fouls committed, a lower threshold for blowing, or both, and this data cannot separate them. That ambiguity is exactly why the conversion rate is the more interesting half of the decomposition.
- Cards are not equal and not timed. A second yellow and a straight red are bundled as one red here, and the feed carries no card minute, so nothing in this piece can distinguish a 12th-minute booking from an 89th-minute one. A game-state analysis would need those timestamps, and the direction of that bias is known: trailing teams foul more, so card counts partly measure scorelines.
- Fixtures are not randomly assigned. Three rounds is not a random sample of a season's matches. Every club has played three specific opponents, and derbies, relegation six-pointers and mismatches carry different foul rates. The schedule-strength piece priced how unequal an opening fixture list can be; the same asterisk applies to a foul count.
- One provider, no officials. Fouls and cards come from a single public feed, which is not the league's own record, and it carries no referee identity. Nothing here can attribute a rate to an individual official, and we have not tried.
- The power problem, quantified. To establish a difference of 0.119 cards a match at the 95% level, at these rates, would take about 1,012 matches, or 2.7 Premier League seasons. Any claim about this season's discipline that rests on a fortnight is unfalsifiable in the same breath it is made.
What we would watch instead
The gradient that does hold up, on a full season, is the one between discipline and defeat. Across all 380 matches of 2025-26, the winning side averaged 1.757 cards, the drawing sides 1.875 and the losing side 2.149. That is the same ordering the 2026 World Cup produced across 104 games, on a different continent under different officials, and it is the ordering worth tracking through the autumn, because it needs no claim about the referees at all. Losing produces cards at least as reliably as cards produce losing.
Two individual matches survive the sample-size objection, because they are single events rather than rates. Newcastle 2-2 Liverpool on 23 August produced 8 yellows, the season's chippiest game so far and, notably, still short of the two 10-card matches of last season. And Fulham 2-3 Crystal Palace on 5 September managed 13 fouls and no cards at all — the only clean sheet on the discipline ledger so far, against 14 such matches across last season. Neither means anything about a trend. Both actually happened, which is more than can be said for the crackdown.
Reproduce it
Both datasets are served here, so nothing rests on trust. This season is at /data/epl_2026_27_results.json (completed matches only, per-team box scores included, refreshed before every build); last season is at data_layer/epl_2025_26_boxscores.json, all 380 matches with the same fields. The recipe, in order: filter this season's file to the 21 August-6 September window and sum foulsCommitted, yellowCards and redCards for both teams in each match; do the same on all 380 rows of last season; divide by match counts for the rates and yellows by fouls for conversion. For the noise band, take last season's per-match card totals, compute the mean and variance for the dispersion index, and use the square root of the mean over 30 for the standard error of a 30-match mean. For the window test, slide a 30-match window along last season in date order and count how many windows land further from the season mean than this season does. The club panel is each club's yellows over its fouls in each season, with the binomial band drawn at the league rate on the median club's foul count. Every one of those steps is in the chart script, which fails the build if a published figure moves.
The running league-wide numbers this piece is arguing about update themselves on the 2026-27 tracker. Our advice for the discipline column is the same advice the table got on opening night: come back at game ten, and until then treat every card table as a coin someone has flipped three times.
Sources & further reading
- 2026-27 results and box scores: ESPN’s public scoreboard and summary feeds for eng.1, completed matches only, pulled by
data_layer/refresh_epl.pyand served at/data/epl_2026_27_results.json(50 completed matches as of 2026-09-25; this piece reads the 2026-08-21 to 2026-09-06 window of it). - 2025-26 discipline baselines — every foul, yellow and red in all 380 matches:
data_layer/epl_2025_26_boxscores.json, pulled from the same feed bybuild_epl_2025_boxscores.pyand cross-checked row-for-row againstdata_layer/epl_2025_26_results.json. - The same discipline question at a tournament, including the cards-by-result gradient: Discipline and Defeat at the 2026 World Cup.
- The referee-bias literature behind the away-card premium, measured on 3,425 StatsBomb domestic matches: Home Advantage, Quantified.
- Why a Poisson band is the right yardstick for a count, and where football breaks it: Do Football Goals Follow a Poisson?
- The same sample-size argument aimed at the league table, and at the fixture list: The Table Lies Until October and Schedule Strength Is Real.
- What else these 30 box scores have said so far: Matchweek One Under the Hood and Matchweek Two.
- Why card and foul counts partly measure the scoreline: Game State Effects on Stats.
- Reproduction: the two datasets above plus the recipe in “Reproduce it” — 149 published figures, all recomputed by
charts/chart_epl_discipline_baseline.pyat build time.
More from Data Deep-Dives
Does Europe Cost English Clubs at the Weekend? Three Seasons Can't Find It
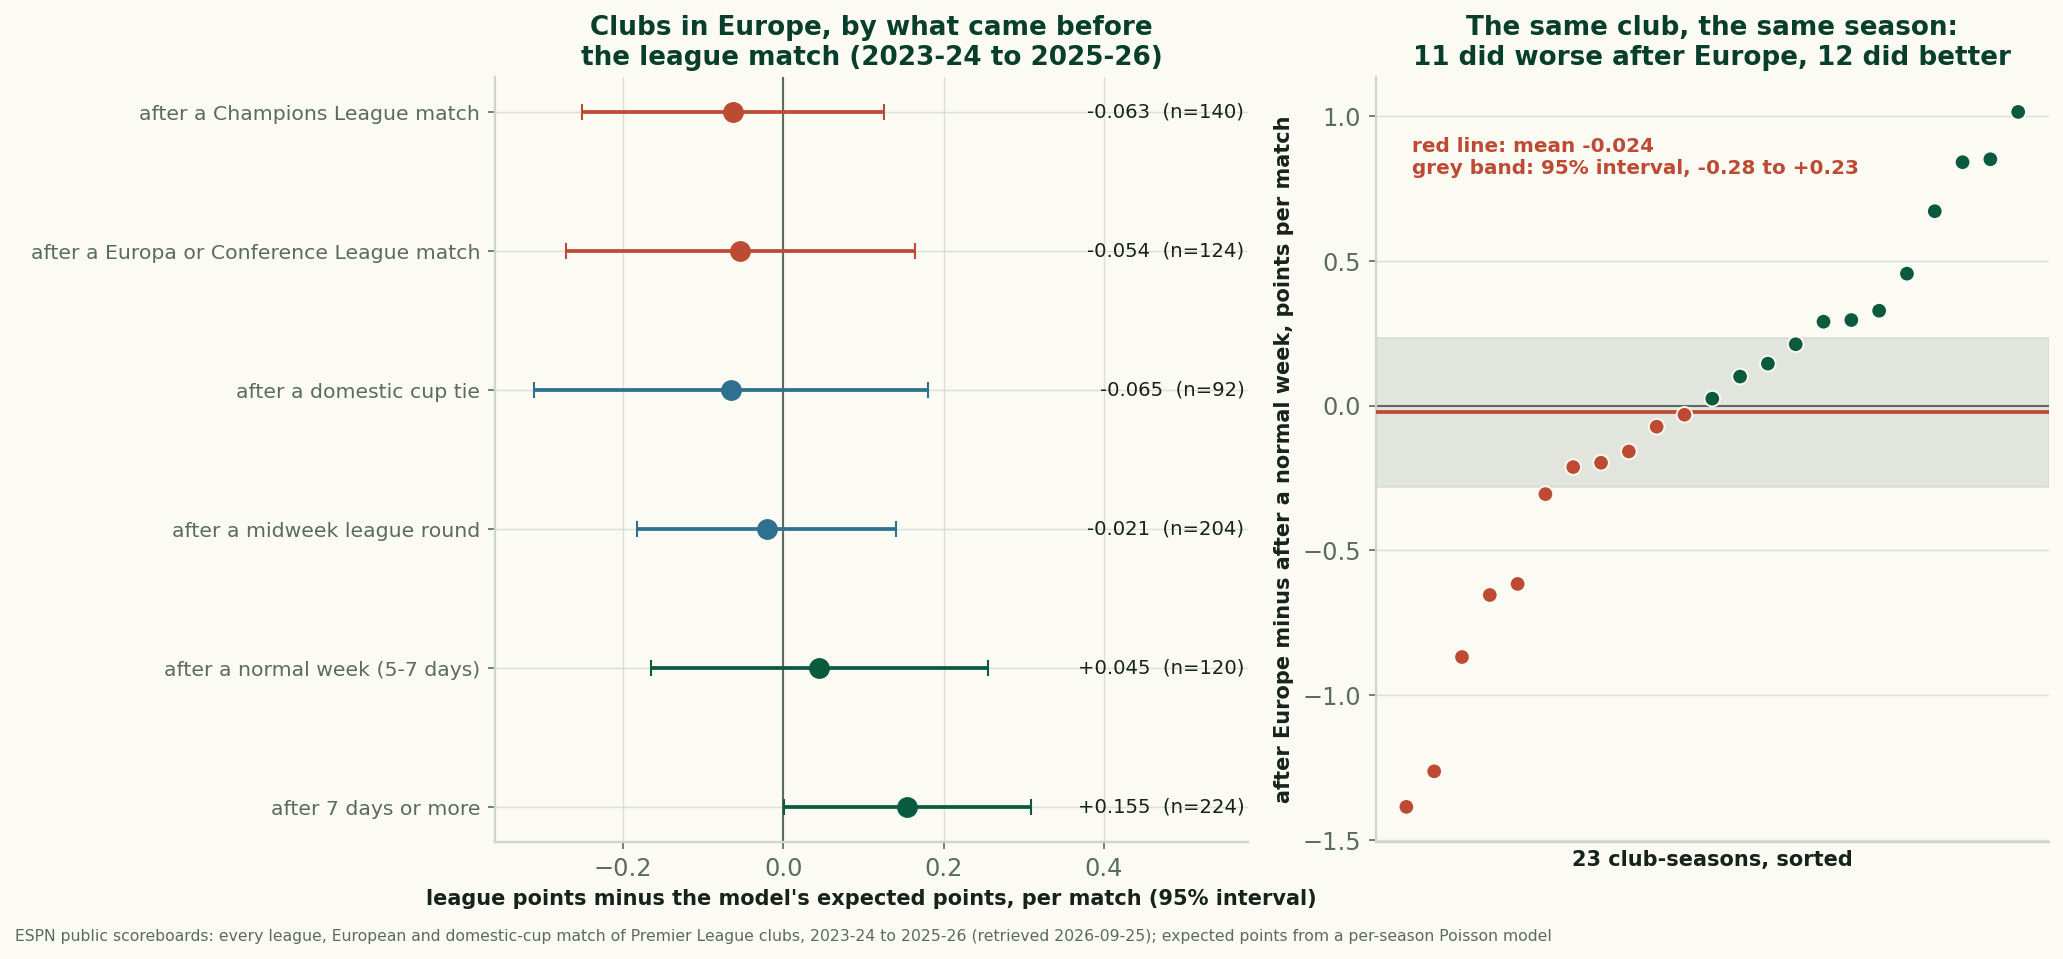
After a European night, English clubs took 1.56 league points a match against 1.62 expected. Within the same club and season the gap is -0.024: not measurable.
Manchester United Lead the League in Shots and Sit Twelfth
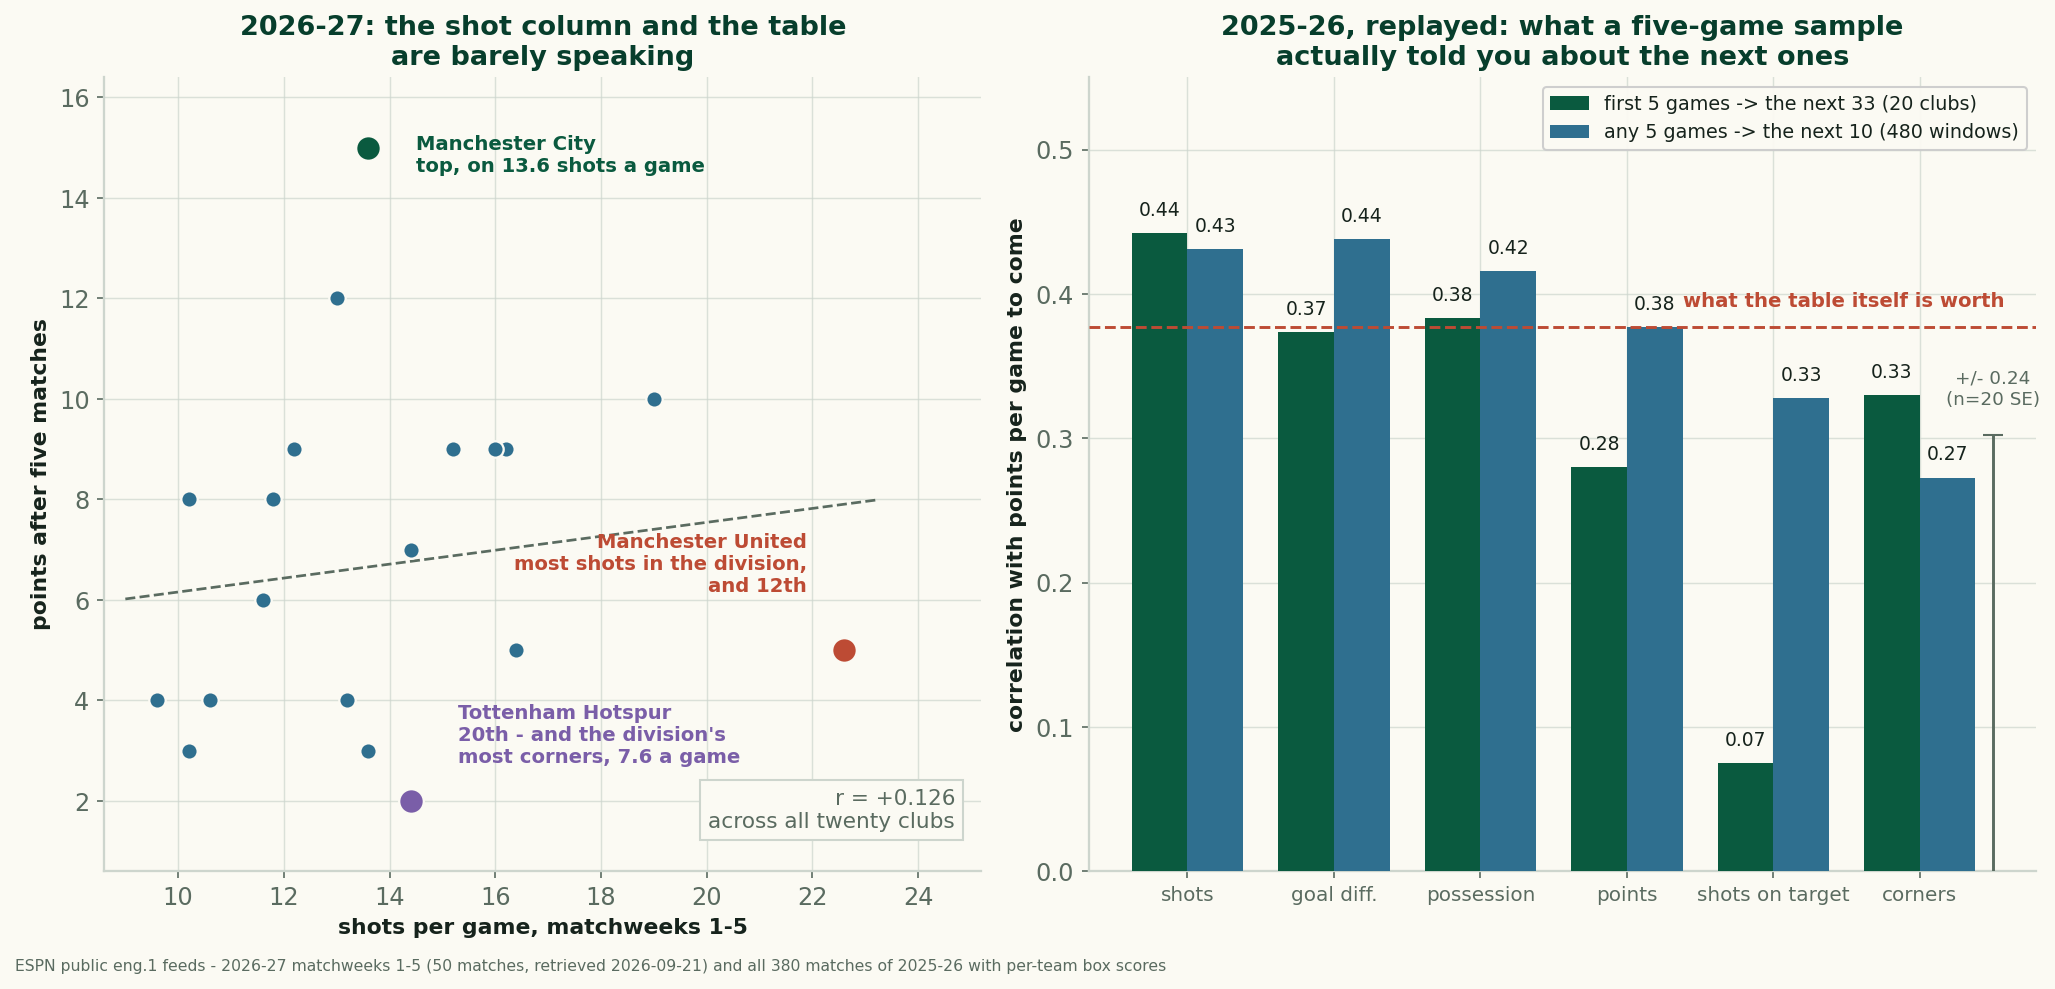
United take 22.6 shots a game and have 5 points. Across 2025-26, a club's five-game shot count predicted its next results better than its points did.
Home Advantage Didn't Die. The Results Column Can't See It
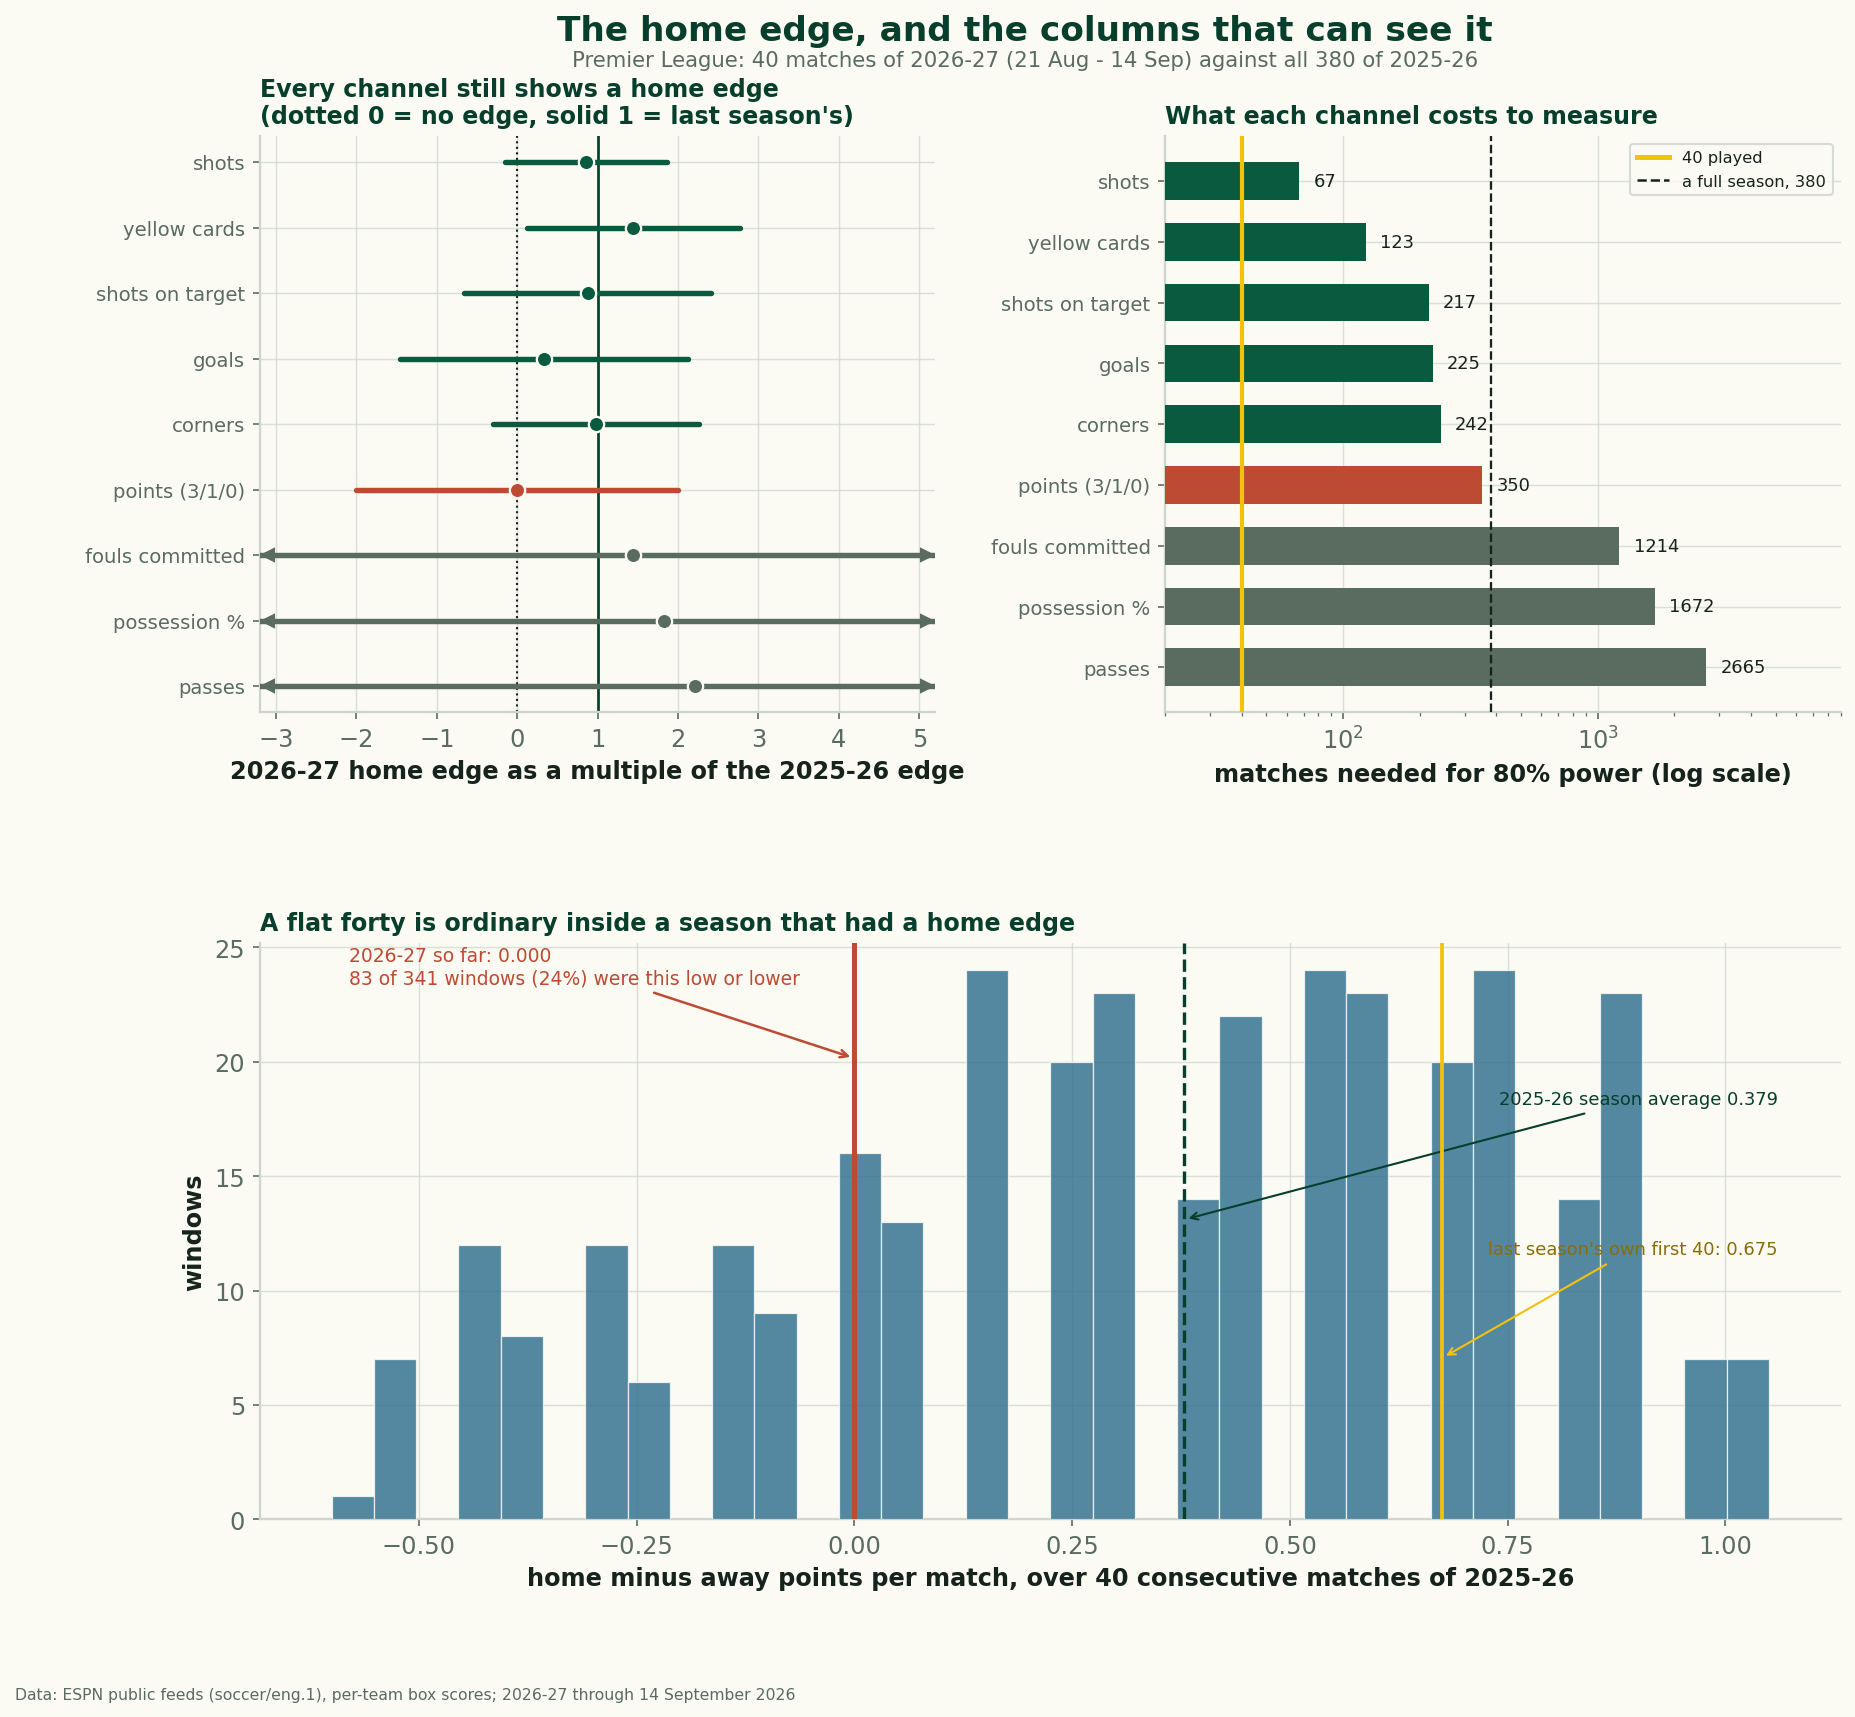
Home and away split the first 40 matches of 2026-27 evenly, yet the shot, corner and card columns keep the home edge. Plus a decade of home-advantage data.