This page forecasts the rest of the 2026-27 Premier League with a statistical model: a projected final table, and each club's chance of winning the title, finishing in the top four and going down. It is a methods piece as much as a table. Every number comes from a Poisson goals model fitted to results, run through 20,000 simulated seasons, and tested the same way on 23 past seasons before we trusted it with this one. This edition uses the 100 matches completed by 8 November 2026 (every club has played 10), pulled on 16 November 2026.
Three things to know before the table. The percentages are model probabilities, not certainties: a club given 20% should finish there about one season in five. The model sees only goals scored and conceded, home or away, this season and last; it knows nothing about injuries, transfers or managers. And it has a track record you can check: after 100 matches of past seasons its chances were close to the rates at which things actually happened (the calibration section).
The projected 2026-27 Premier League table
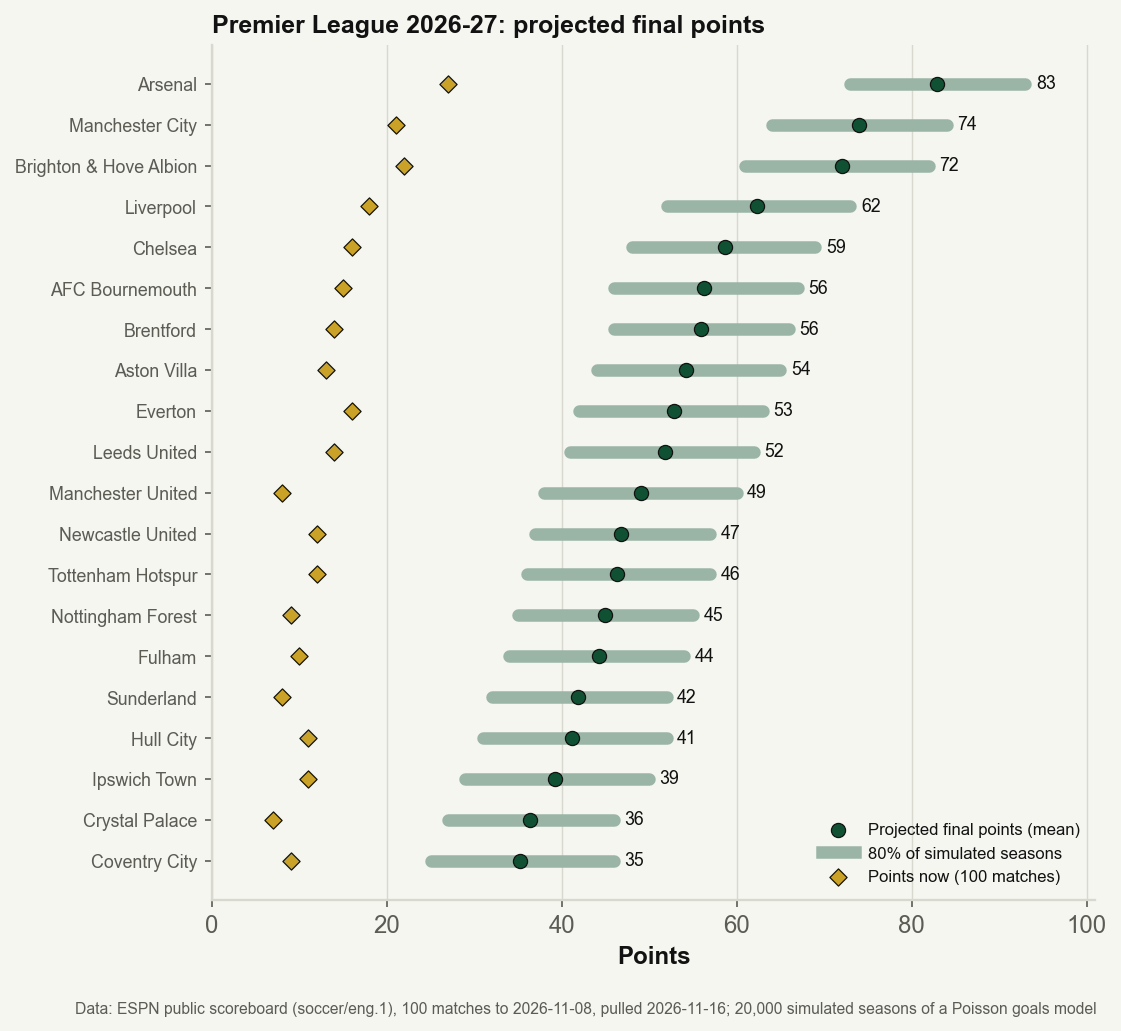
Clubs are ordered by projected final points, the average over 20,000 simulated seasons. The range is the middle 80% of those seasons: one simulated season in ten finished below it and one in ten above it. A dash means the event did not happen in any of the 20,000 seasons, which puts it below about 1 in 20,000 under this model, not at zero.
| Proj. | Club | Now | Pts | GD | Proj. pts | 80% range | Title | Top four | Relegated |
|---|---|---|---|---|---|---|---|---|---|
| 1 | Arsenal | 1 | 27 | +10 | 83 | 73–93 | 67% | 99% | – |
| 2 | Manchester City | 3 | 21 | +8 | 74 | 64–84 | 18% | 89% | – |
| 3 | Brighton & Hove Albion | 2 | 22 | +19 | 72 | 61–82 | 12% | 84% | – |
| 4 | Liverpool | 4 | 18 | +4 | 62 | 52–73 | 1% | 40% | <1% |
| 5 | Chelsea | 5 | 16 | +3 | 59 | 48–69 | 1% | 24% | 1% |
| 6 | AFC Bournemouth | 7 | 15 | +2 | 56 | 46–67 | <1% | 15% | 1% |
| 7 | Brentford | 8 | 14 | +5 | 56 | 46–66 | <1% | 15% | 1% |
| 8 | Aston Villa | 10 | 13 | -3 | 54 | 44–65 | <1% | 10% | 2% |
| 9 | Everton | 6 | 16 | +2 | 53 | 42–63 | <1% | 8% | 3% |
| 10 | Leeds United | 9 | 14 | +2 | 52 | 41–62 | <1% | 6% | 4% |
| 11 | Manchester United | 18 | 8 | -5 | 49 | 38–60 | <1% | 4% | 7% |
| 12 | Newcastle United | 12 | 12 | -3 | 47 | 37–57 | – | 2% | 12% |
| 13 | Tottenham Hotspur | 11 | 12 | -1 | 46 | 36–57 | – | 1% | 13% |
| 14 | Nottingham Forest | 16 | 9 | -4 | 45 | 35–55 | – | 1% | 16% |
| 15 | Fulham | 15 | 10 | -2 | 44 | 34–54 | – | 1% | 17% |
| 16 | Sunderland | 19 | 8 | -9 | 42 | 32–52 | – | <1% | 29% |
| 17 | Hull City (promoted) | 13 | 11 | 0 | 41 | 31–52 | – | 1% | 32% |
| 18 | Ipswich Town (promoted) | 14 | 11 | -5 | 39 | 29–50 | – | <1% | 43% |
| 19 | Crystal Palace | 20 | 7 | -14 | 36 | 27–46 | – | <1% | 57% |
| 20 | Coventry City (promoted) | 17 | 9 | -9 | 35 | 25–46 | – | <1% | 63% |
Title, top-four and relegation chances
The title. Arsenal have 27 points from 10 matches (nine wins) and win the title in 66.9% of simulated seasons. Manchester City (18.0%) and Brighton & Hove Albion (12.4%) take most of the rest; Liverpool are at 1.3%. The simulated champion's points had a median of 85 (80% range 78 to 93); across the 24 seasons from 2002-03 to 2025-26 the champion's median was 89, from 80 to 100.
The prior at work. Brighton sit above Manchester City in the real table on points (22 to 21) and goal difference (+19 to +8), yet the model projects City two points higher. That is the model doing what it was built to do: ten matches are a small sample, so each club's rating starts from last season's and moves only as far as this season's goals justify. City's attack rating last season was the league's best; Brighton's was close to average. If Brighton keep scoring at their current rate, the ratings will follow them week by week.
The top four. Arsenal (99%), City (89%) and Brighton (84%) are well placed; the fourth place is open, with Liverpool at 40% and Chelsea at 24%. Fourth place needed a median of 66 points in the simulations (80% range 62 to 71), against a 24-season median of 69. How many European places a top-four or lower finish brings depends on the cup winners and UEFA's rules for that season, which the model does not see, so we report league position only.
Relegation. Coventry City (63%), Crystal Palace (57%) and Ipswich Town (43%) go down most often, with Hull City (32%) and Sunderland (29%) next. Manchester United are 18th on 8 points but go down in only 7.5% of simulated seasons: they have scored 14 goals in 10 matches, their attack rating is the fourth best in the league (last season's was the third best), and the model expects their points to catch up with their goals. Seventeenth place, the last safe one, took a median of 39 points in the simulations (80% range 35 to 42); the 24-season median is 38. For how much the table can still move from here, see the table lies until October and points after six games and relegation.
The model: Poisson goals with last season as a prior
The engine is the model graded on our win-probability explainer (Maher's 1982 attack-and-defence model). Each club has an attack rating a and a defence rating d (goals allowed, so higher is worse), and the league has a scoring level μ and a home factor h:
home goals ~ Poisson(exp(mu + h + a_home + d_away))
away goals ~ Poisson(exp(mu + a_away + d_home))
The two scores are independent. The new part is how the ratings are fitted mid-season. After 10 matches a club's goals tell us something, but not much, so we fit by maximum a posteriori: the likelihood of this season's 100 results times a normal prior on each rating.
- Clubs that were in the league last season start from their full-season 2025-26 rating, pulled 20% of the way back to average (a factor of 0.8), with a prior standard deviation of 0.15 on the log scale.
- Promoted clubs (Coventry City, Hull City and Ipswich Town) have no Premier League matches last season. Their prior is the average first-season rating of the 69 promoted clubs from 2003-04 to 2025-26: an attack 21% below the league average and a defence that concedes 25% more, with the variation those clubs actually showed (standard deviations 0.22 and 0.18). Our earlier grading gave them the league average, which the explainer itself called crude.
- The league level and home factor start from last season's values with standard deviations of 0.15 and 0.10. The fitted home factor this season is 1.26: home sides are expected to score about 26% more than the same team away.
We fit with Newton's method, which converges in a handful of steps because the log posterior is concave. The two settings, the pull factor and the prior width, were not hand-picked: we tried 42 combinations on 23 past seasons, fitting each season's first 100 matches and scoring the forecasts for its remaining 280, and kept the pair with the lowest log loss with each test season left out of its own choice. Every one of the 23 left-out runs chose the same pair (0.8 and 0.15).
| Ratings fitted from | Log loss |
|---|---|
| Last season as a prior, updated with this season (the model) | 0.982 |
| Last season only, never updated | 0.990 |
| This season only (no prior) | 1.035 |
| No ratings: league home/draw/away rates | 1.062 |
The ordering is the useful part. Ten matches of this season on their own are worse than last season frozen, and the blend beats both. That is the statistical case for the prior.
The simulation
With ratings in hand, we play out the 280 remaining fixtures (every home-and-away pairing not yet played; the ESPN fixture list pulled the same day lists the same 280) 20,000 times. Each simulated season does two things:
- Draws the ratings. The fitted ratings are estimates, not facts. Each simulated season draws its own set from the normal approximation to the posterior (the Laplace approximation, using the inverse of the Hessian from the fit). This is what turns a points estimate into an honest range.
- Draws the goals. Each remaining match gets Poisson goals for both sides from those ratings. The season's table then ranks clubs on points, goal difference and goals scored; a tie on all three is settled by a coin flip, because the real rules' head-to-head steps are not modelled.
Title, top-four and relegation chances are the shares of simulated seasons in which each thing happened. With 20,000 seasons, the simulation noise on a 50% chance is about ±0.7 percentage points (95%), far smaller than the model's own uncertainty.
Does it work? A backtest on 23 seasons
A projection is only as good as its record, so we ran the identical procedure on every Premier League season from 2003-04 to 2025-26: fit on the first 100 matches in kick-off order (the same point as this edition), simulate 10,000 seasons, and compare with the final table. Final tables are computed from results, so points deductions are not applied. That gives 460 club-seasons. The baselines are the simple rules people use: points pace (points per game so far × 38), last season's points (promoted clubs: the 36.4-point average of past promoted clubs), and points so far plus league-average points (1.38 a match) for each match left.
| Method | RMSE | MAE |
|---|---|---|
| The model (mean of simulated seasons) | 8.2 | 6.5 |
| Last season's points | 11.6 | 9.1 |
| Points pace | 12.5 | 10.0 |
| Points so far + league average | 13.1 | 10.5 |
The model's typical miss is about 6 points, against 9 to 11 for the simple rules. Because the 20 clubs of a season share its quirks, we resampled whole seasons (10,000 bootstrap draws) to put intervals on the gaps: the model's mean squared error is lower than last season's points by 53 to 87 points², than points pace by 72 to 108, and than the league-average rule by 90 to 120 (95% intervals). Ranked by projected points, the model's finishing position was off by 2.38 places on average; the table after 100 matches was off by 2.84.
Ranges. The model's 80% ranges contained the club's final points in 80.7% of club-seasons, almost exactly the 80% they claim. A version that skips step 1 of the simulation (treating the fitted ratings as exact) covered only 69.3%: its ranges were too narrow. Projected points barely change between the two (RMSE 8.2); the difference is entirely in how honest the uncertainty is.
Who was top. The leader after 100 matches won the title in 13 of 23 seasons; the model's favourite won it in 14. They disagreed in 5 seasons; the favourite was right in 2 of them (2022-23, 2023-24), the leader in 1 (2024-25).
Calibration: are the percentages honest?
A 30% chance should come off about 30% of the time. We pooled the backtest's title, top-four and relegation chances (1,380 forecasts) and graded them two ways: the Brier score (the mean squared gap between the probability and what happened, 0 = perfect) and a reliability table.
| Event | Model | Fixed ratings | Table only | Base rate |
|---|---|---|---|---|
| Title | 0.025 | 0.025 | 0.034 | 0.047 |
| Top four | 0.059 | 0.060 | 0.085 | 0.160 |
| Relegation | 0.074 | 0.074 | 0.088 | 0.127 |
Against the table-only simulation, the model cuts the Brier score by 25% for the title, 30% for the top four and 17% for relegation. Season-bootstrap 95% intervals for the improvement all exclude zero (title 0.002 to 0.015; top four 0.011 to 0.038; relegation 0.007 to 0.023). So knowing who is good adds real information to knowing who is top. Log loss tells the same story (in the data file). Fixing the ratings hardly moves the Brier score; it is the points ranges, above, where rating uncertainty matters.
| Forecast bin | Forecasts | Average forecast | Happened | 95% range |
|---|---|---|---|---|
| 0% to 2% | 821 | 0.2% | 2 (0.2%) | 0.1–0.9% |
| 2% to 10% | 169 | 5.2% | 9 (5.3%) | 2.8–9.8% |
| 10% to 30% | 170 | 18.6% | 26 (15.3%) | 10.7–21.5% |
| 30% to 50% | 72 | 39.5% | 32 (44.4%) | 33.5–55.9% |
| 50% to 70% | 58 | 60.4% | 37 (63.8%) | 50.9–74.9% |
| 70% to 90% | 53 | 80.2% | 41 (77.4%) | 64.5–86.5% |
| 90% to 98% | 24 | 94.7% | 24 (100.0%) | 86.2–100.0% |
| 98% to 100% | 13 | 99.3% | 13 (100.0%) | 77.2–100.0% |
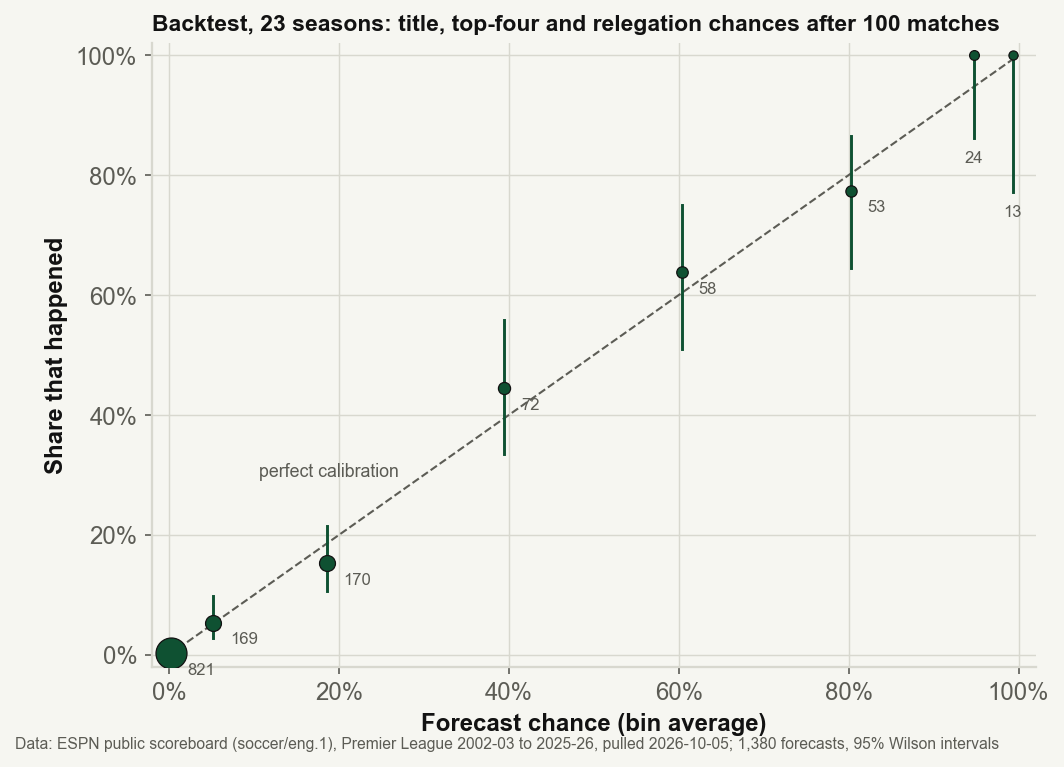
Every bin's interval contains its average forecast. The model's long shots are honest too: 821 forecasts under 2% averaged 0.24% and 2 came off, about the 2.0 you would expect. Those two are the famous ones: Leicester City's 2015-16 title, given 0.23% after 100 matches (see Leicester 2015-16, revisited and the most improbable seasons), and Newcastle United's top-four finish in 2022-23, given 1.6%. Nothing the model put above 95% failed to happen. Twenty-three seasons are still a modest sample for the middle bins, which hold 53 to 72 forecasts each.
How the match model has done on this season
The match-level grading on our win-probability explainer still stands. That version was fitted on 2025-26 only, frozen before the season, with promoted clubs at the league average. On the 89 matches to 1 November 2026 it scored a three-outcome Brier of 0.610 against 0.659 for last season's home/draw/away rates and 0.667 for a flat third each; the 95% interval for its improvement over the rates was 0.009 to 0.089. Extended to all 100 matches to 8 November 2026, it scores 0.612 against 0.655. On the 11 newest matches alone it scored 0.626 against 0.618, slightly worse than the rates; eleven matches are far too few to read anything into. The projection on this page goes further than that frozen version, since it updates every rating with this season's goals.
What the model can't see
- Squads and managers. Injuries, suspensions, transfers in January and managerial changes reach the model only once they show up in goals.
- Chance quality. It rates clubs on goals, not shots or expected goals, so a club that is finishing far above its chances will look stronger than it is for a while (see expected goals, explained).
- Draws. Independent Poisson scores give too few draws: on 2025-26 the fitted model expected 23.7% against 27.4% actual (do football goals follow a Poisson?). Too few draws means slightly too many points in the simulations, shared across all clubs.
- The schedule. Fixture congestion, European travel and end-of-season motivation are not in it; every remaining match is played at full strength by both sides.
- The rule book. Points deductions, and head-to-head tiebreaks beyond goals scored, are not modelled.
- The future of the ratings. Ratings are drawn once per simulated season and held fixed; real form drifts within a season. The backtest's 80% coverage suggests this costs little at this point of the season, but that check is for 100 matches in, not for the run-in.
Other ways to read the season: Title Pace sets each club's results beside the 10 best Premier League seasons, without forecasting, and the 2026-27 season by the numbers tracks goals, draws and home advantage from completed matches only. For how rating systems differ, see soccer power ratings: Elo and SPI.
Reproduce it
Everything above is computed by our analysis script from two files the site already serves: /data_layer/epl_goal_times_2002_2027.json (every match from 2002-03 to 2025-26, 9,170 after removing a duplicated 2009-10 listing) and /data_layer/epl_2026_27_results.json (read up to kick-offs on 16 November 2026, so later pulls don't move these numbers). No network, nothing hand-entered; the random seed is fixed (20261116), and every figure is written to /data/stats/premier-league-predictions.json. The core, in Python with NumPy:
import numpy as np

def fit(X, goals, prior_mean, prior_sd, steps=50):
    # X: one row per team-match (intercept, home, attack, defence one-hots)
    theta, prec = prior_mean.copy(), 1 / prior_sd**2
    for _ in range(steps):
        lam = np.exp(X @ theta)
        grad = X.T @ (goals - lam) - prec * (theta - prior_mean)
        hess = (X.T * lam) @ X + np.diag(prec)
        theta += np.linalg.solve(hess, grad)
    return theta, np.linalg.inv(hess)          # estimate, Laplace covariance

def simulate(theta, cov, X_home, X_away, rng, n=20000):
    draws = rng.multivariate_normal(theta, cov, size=n)    # rating uncertainty
    home = rng.poisson(np.exp(draws @ X_home.T))           # n x remaining matches
    away = rng.poisson(np.exp(draws @ X_away.T))
    return home, away    # then add points to the current table and rank
The backtest is the same two functions in a loop over seasons, with the prior built from the season before. For the model written out step by step, see building a Poisson goals model in Python. This page is refreshed in place when the results file is re-pulled; the as-of date at the top names the edition.
Where these numbers come from
- ESPN public scoreboard (soccer/eng.1): Premier League results 2002-03 to 2025-26 (
data_layer/epl_goal_times_2002_2027.json, pulled 2026-10-05) and the 100 completed 2026-27 matches to 8 November 2026 (data_layer/epl_2026_27_results.json, pulled 2026-11-16). - M. J. Maher, “Modelling association football scores”, Statistica Neerlandica 36 (1982): the attack-and-defence Poisson model. M. J. Dixon and S. G. Coles, Applied Statistics 46 (1997): its low-score correction and time-weighting, not used here.
- G. W. Brier, “Verification of forecasts expressed in terms of probability”, Monthly Weather Review 78 (1950): the Brier score.
- E. B. Wilson, “Probable inference, the law of succession, and statistical inference”, Journal of the American Statistical Association 22 (1927): the score interval used for the reliability table.
- Related studies, each rescored on this season's results to 8 November: what points after six games say about relegation, the round after an international break, what the table after five games cannot see and whether a European midweek costs clubs at the weekend.
- The match-level grading restated above: how win-probability models work (calibration section added 5 November 2026).
Published by SoccerAnalytics from public data and the sources named in this piece. How this site is made.